| dataset | group | mean_clip |
|---|---|---|
| 1 | hc | 0.2213 |
| 1 | scz | 0.2398 |
| 1 | DIFF: | -0.0185 |
SMI paper
1 index
1.1 snc
16065.1.2
2 the einleitung
inspired by the paper […], (ref?), who found evidence for […] we tried to replicate the pipeline of […].
Our first draft essai proves their hypothesis […].
3 background
3.1 preliminary
- embedding into class subject
- […]
3.2 literature
3.3 hypothesis
[…]
4 material/methods
please cf. Schwarz (2026#todo) for the corpus building and evaluation scripts
4.1 data
our corpus consists of interview transcripts available in raw text which were tokenised and segmented into 10-unit chunks for further processing, Section 4.2.
4.1.1 corpus stats
| dataset | group | participants | tokens |
|---|---|---|---|
| 1 | HC | 13 | 21650 |
| 1 | SCZ | 16 | 92250 |
4.2 computations
the computation of clip scores was done using HU resources with a python script cf. Nenchev (2026)
5 results
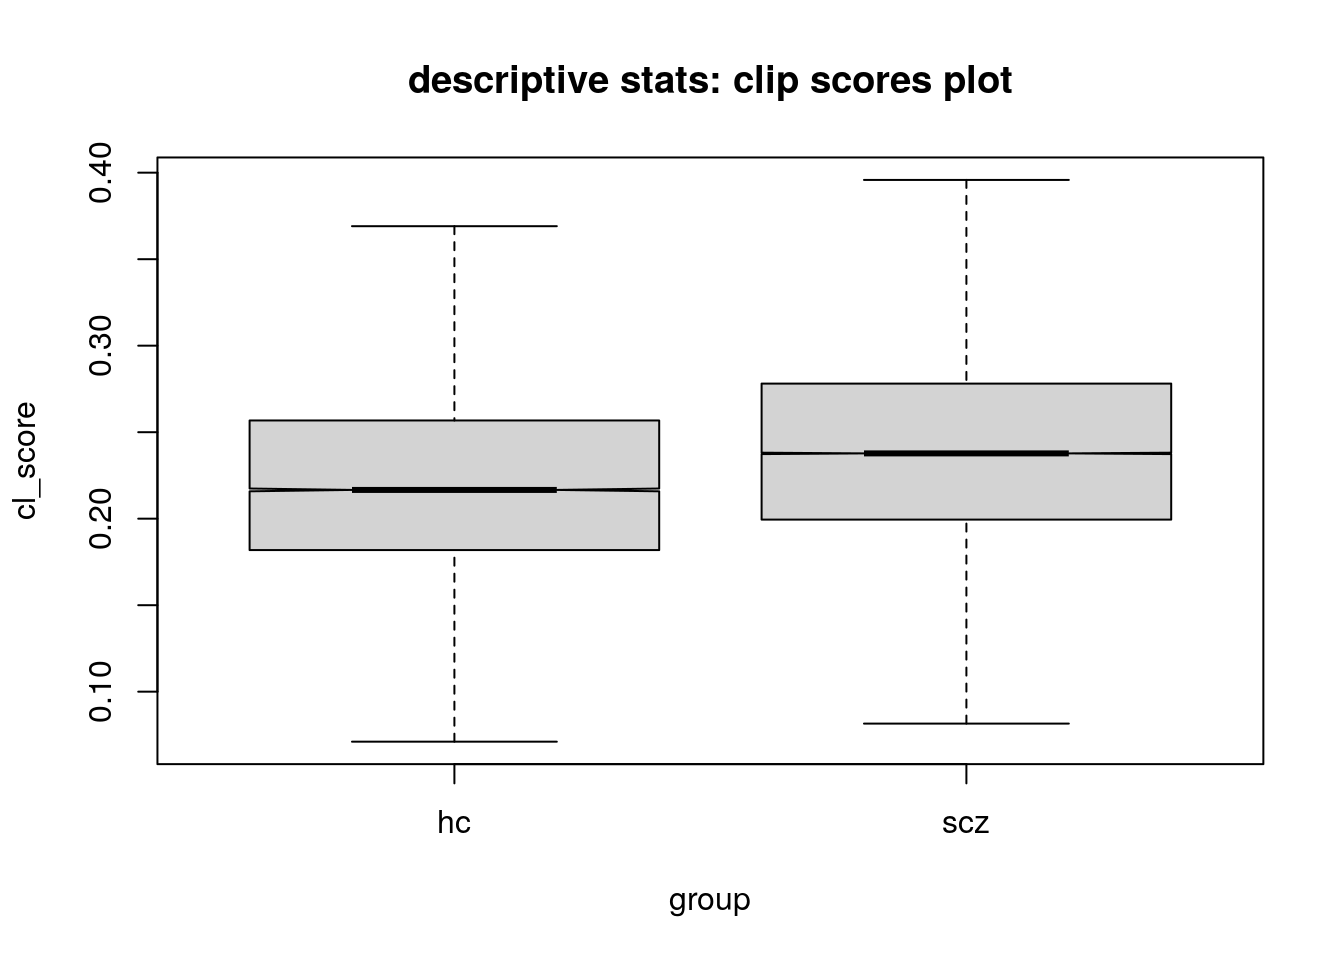
5.1 basic descriptive
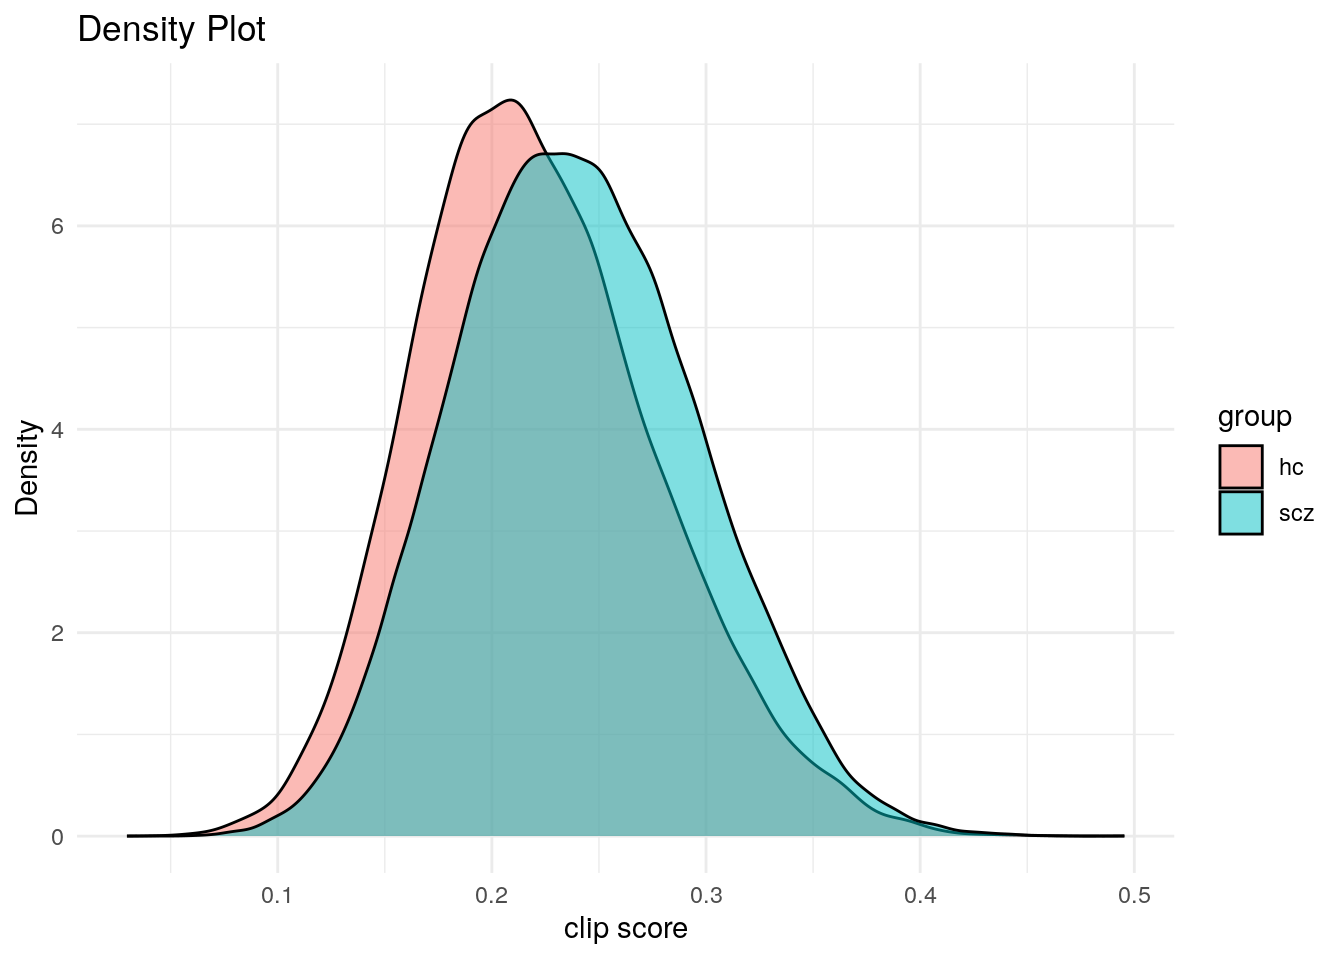
first simple descriptive stats insights which are to test for stability…
5.2 visuals
[…]
raffael script (commit hash!) from ggl-doc: Richter (2026)
5.3 linear regression
to prove descriptive results, we compute the stability […] with a linear regression model using R’s lme4::lmer() function, cf. Bates et al. (2015). coefficents are printed below […]
5.3.1 basic (lm)
formula: clipscore ~ group
Call:
lm(formula = cl_score ~ group, data = dff4)

Residuals:
     Min       1Q   Median       3Q      Max
-0.21020 -0.04017 -0.00256  0.03779  0.27403

Coefficients:
             Estimate Std. Error t value Pr(>|t|)
(Intercept) 0.2213234  0.0003823  578.94   <2e-16 ***
groupscz    0.0184706  0.0004248   43.48   <2e-16 ***
---
Signif. codes:  0 '***' 0.001 '**' 0.01 '*' 0.05 '.' 0.1 ' ' 1

Residual standard error: 0.05625 on 113898 degrees of freedom
Multiple R-squared:  0.01633,   Adjusted R-squared:  0.01632
F-statistic:  1891 on 1 and 113898 DF,  p-value: < 2.2e-16
5.3.2 mixed effects model (lmer)
formula: clipscore ~ group + (1|TN)+(1|text_chunk)+ld+fstPPr_rate < positing random effects for participant and token and fixed effects for type/token ratio (lexical diversity factor) and 1st-person-pronoun rate.
Linear mixed model fit by REML. t-tests use Satterthwaite's method [
lmerModLmerTest]
Formula: cl_score ~ group + (1 | TN) + (1 | text_chunk) + ld + fstPPr_rate
   Data: dff4

REML criterion at convergence: -406293.2

Scaled residuals:
    Min      1Q  Median      3Q     Max
-4.7324 -0.5891 -0.0624  0.4691  6.2275

Random effects:
 Groups     Name        Variance  Std.Dev.
 text_chunk (Intercept) 1.631e-03 0.040381
 TN         (Intercept) 7.633e-05 0.008737
 Residual               1.476e-03 0.038419
Number of obs: 113900, groups:  text_chunk, 3653; TN, 29

Fixed effects:
             Estimate Std. Error        df t value Pr(>|t|)
(Intercept)  0.234962   0.010406 27.942796  22.579  < 2e-16 ***
groupscz     0.023571   0.004146 28.049269   5.685 4.26e-06 ***
ld          -0.026691   0.034733 36.448483  -0.768    0.447
fstPPr_rate -0.189069   0.122592 24.946504  -1.542    0.136
---
Signif. codes:  0 '***' 0.001 '**' 0.01 '*' 0.05 '.' 0.1 ' ' 1

Correlation of Fixed Effects:
            (Intr) grpscz ld
groupscz    -0.217
ld          -0.731  0.280
fstPPr_rate -0.696 -0.261  0.105
5.3.2.1 helper interpretation, to be tested
the coefficients interesting for us are
6 discussion
7 limitations
8 perspectives
9 ethics
10 acknowledgement
11 references
Bates, Douglas, Martin Mächler, Ben Bolker, and Steve Walker. 2015. “Fitting Linear Mixed-Effects Models Using Lme4.” Journal of Statistical Software 67 (1): 1–48. https://doi.org/10.18637/jss.v067.i01.
huggingface. n.d. “Google Colab.” Accessed December 15, 2025. https://colab.research.google.com/github/huggingface/notebooks/blob/main/diffusers/stable_diffusion.ipynb.
Nenchev, Ivan. 2026. “Clip Score Computation.” https://github.com/esteeschwarz/SPUND-LX/blob/main/mental-img/clip_scores.ipynb.
Nenchev, Ivan, Berlin Institute of Health at Charité – Universitätsmedizin Berlin, Germany, Christiane Montag, Department of Psychiatry and Psychotherapy, Charité Campus Mitte, Charité – Universitätsmedizin Berlin, corporate member of Freie Universität Berlin, Humboldt-Universität zu Berlin, and Berlin Institute of Health, Germany, Sandra Anna Just, Department of Psychiatry and Psychotherapy, Charité Campus Mitte, Charité – Universitätsmedizin Berlin, corporate member of Freie Universität Berlin, Humboldt-Universität zu Berlin, and Berlin Institute of Health, Germany, and Department of Clinical Medicine, UiT – The Arctic University of Norway, Tromsø, Norway. 2025. “Reverse Prompting: A Novel Computational Paradigm in Schizophrenia Based on Large Language Models.” In, 797–806. https://doi.org/10.26615/978-954-452-098-4-092.
Patil, Suraj, Pedro Cuenca, Nathan Lambert, and Patrick von Platen. 2022. “Stable Diffusion with 🧨 Diffusers.” Hugging Face Blog. https://huggingface.co/blog/stable_diffusion.
Pillny, Matthias, David J. Hallford, and Kerem Böge. 2024. “The Nature of Mental Imagery and Its Relationship With Amotivational Psychopathology in People With Schizophrenia Spectrum Disorders.” Behavior Therapy 55 (4): 885–97. https://doi.org/10.1016/j.beth.2024.01.009.
Princeton U. 2005. “Current Version.” Wordnet. https://wordnet.princeton.edu/download/current-version.
Richter, Raffael. 2026. “Evaluation Script (Clip Evaluation, Visualisations) for p… · Esteeschwarz/SPUND-LX@01d293b.” https://github.com/esteeschwarz/SPUND-LX/commit/01d293bfa731f80944ec1298699c15543d6dbcd7.
Schwarz, St. 2026. “This Paper Scripts.” https://github.com/esteeschwarz/SPUND-LX/tree/main/mental-img.
Tucker, Benjamin V., Daniel Brenner, D. Kyle Danielson, Matthew C. Kelley, Filip Nenadić, and Michelle Sims. 2019. “The Massive Auditory Lexical Decision (MALD) Database.” Behavior Research Methods 51 (3): 1187–1204. https://doi.org/10.3758/s13428-018-1056-1.
Wu, Si. 2025. “Swsiwu/Composition_and_deformance.” https://github.com/swsiwu/composition_and_deformance.
Yates, Andrew, Bart Desmet, Emily Prud’hommeaux, Ayah Zirikly, Steven Bedrick, Sean MacAvaney, Kfir Bar, Molly Ireland, and Yaakov Ophir, eds. 2024. Proceedings of the 9th Workshop on Computational Linguistics and Clinical Psychology (CLPsych 2024). St. Julians, Malta: Association for Computational Linguistics. https://doi.org/10.18653/v1/2024.clpsych-1.0.