2 xtitle: coherence & propositions
observations in :schizophrenia: threads
date: 2025-07-27 22:18:07
eval output M11, normalised to obs, distance ceiling = outliers removed.
2.1 method (M11)
To compute distances we queried a corpus for matching conditions where certain (assumed) determiners appear before similar nouns. In M11 (removed…)
This distance should give us information structural evidence of how strong these noun occurences are connected, i.e. if a noun appears out of the blue mostly or if it somewhere before has been introduced to the audience. In information structure definitions this would be termed with given and new information (Prince 1981).
2.2 legende
| variable | explanation | values |
|---|---|---|
| target | corpus | obs,ref |
| q | condition | a,b,c,d,e,f |
| det | antecedent POS==DET | TRUE,FALSE |
| q:a | query condition | .* |
| q:b | query condition | this,that,those,these |
| q:c | query condition | the |
| q:d | query condition | a,an,any,some |
| q:e | query condition | my |
| q:f | query condition | his,her,their,your |
2.3 anova analysis
2.3.1 anova plain, formula: [dist_rel_obs ~ target*q*det]
##                   Df     Sum Sq    Mean Sq    F value    Pr(>F)
## target             1 3.6884e+09 3688441713 86368.2495 < 2.2e-16 ***
## q                  5 4.5563e+08   91126214  2133.8040 < 2.2e-16 ***
## det                1 2.8130e+07   28129559   658.6794 < 2.2e-16 ***
## target:q           5 2.6402e+06     528048    12.3647 5.105e-12 ***
## target:det         1 2.3260e+06    2325954    54.4643 1.584e-13 ***
## q:det              1 2.7700e+06    2769968    64.8613 8.044e-16 ***
## target:q:det       1 4.3320e+03       4332     0.1014    0.7501
## Residuals    1045139 4.4634e+10      42706
## ---
## Signif. codes:  0 '***' 0.001 '**' 0.01 '*' 0.05 '.' 0.1 ' ' 1
2.3.2 anova of linear regression model: [anova(summary(lmer))]
## Type III Analysis of Variance Table with Satterthwaite's method
##                Sum Sq Mean Sq NumDF   DenDF  F value    Pr(>F)
## target        6094426 6094426     1  718328 185.7599 < 2.2e-16 ***
## q            42974986 8594997     5 1037780 261.9780 < 2.2e-16 ***
## det            372221  372221     1 1037864  11.3454 0.0007564 ***
## target:q      1766151  353230     5 1037779  10.7666  2.27e-10 ***
## target:det      92612   92612     1 1037867   2.8228 0.0929316 .
## q:det          326995  326995     1 1037796   9.9669 0.0015938 **
## target:q:det   137650  137650     1 1037795   4.1956 0.0405288 *
## ---
## Signif. codes:  0 '***' 0.001 '**' 0.01 '*' 0.05 '.' 0.1 ' ' 1
2.3.3 linear regression coefficients, formula: [dist_rel_obs ~ target*q*det+(1|lemma)+(1|aut_id)]
## Linear mixed model fit by REML. t-tests use Satterthwaite's method ['lmerModLmerTest']
## Formula: eval(expr(lmeform))
##    Data: dfa
##
## REML criterion at convergence: 13864438
##
## Scaled residuals:
##     Min      1Q  Median      3Q     Max
## -6.3215 -0.4316 -0.0874  0.1283 12.4351
##
## Random effects:
##  Groups   Name        Variance Std.Dev.
##  aut_id   (Intercept) 40316    200.8
##  lemma    (Intercept) 42511    206.2
##  Residual             32808    181.1
## Number of obs: 1045155, groups:  aut_id, 4533; lemma, 3652
##
## Fixed effects:
##                        Estimate Std. Error         df t value Pr(>|t|)
## (Intercept)           2.870e+02  4.900e+00  6.838e+03  58.565  < 2e-16 ***
## targetref            -8.842e+01  3.051e+00  7.021e+04 -28.978  < 2e-16 ***
## qb                    3.566e+01  7.380e+00  1.036e+06   4.833 1.35e-06 ***
## qc                    6.937e+01  1.268e+00  1.038e+06  54.728  < 2e-16 ***
## qd                    5.704e+01  1.325e+00  1.038e+06  43.053  < 2e-16 ***
## qe                    7.522e+01  1.447e+00  1.038e+06  51.975  < 2e-16 ***
## qf                    6.010e+01  1.805e+00  1.037e+06  33.291  < 2e-16 ***
## detTRUE               3.154e+00  6.295e-01  1.042e+06   5.011 5.42e-07 ***
## targetref:qb          2.973e+01  1.105e+01  1.038e+06   2.690 0.007140 **
## targetref:qc          1.748e+01  6.460e+00  1.038e+06   2.706 0.006813 **
## targetref:qd          3.302e+01  6.156e+00  1.037e+06   5.363 8.18e-08 ***
## targetref:qe         -2.499e+01  8.090e+00  1.038e+06  -3.090 0.002005 **
## targetref:qf         -1.280e+02  3.760e+01  1.038e+06  -3.404 0.000663 ***
## targetref:detTRUE    -3.951e+00  1.561e+00  1.043e+06  -2.531 0.011370 *
## qb:detTRUE            1.201e+01  7.839e+00  1.036e+06   1.532 0.125614
## targetref:qb:detTRUE  4.436e+01  2.166e+01  1.038e+06   2.048 0.040529 *
## ---
## Signif. codes:  0 '***' 0.001 '**' 0.01 '*' 0.05 '.' 0.1 ' ' 1
## fit warnings:
## fixed-effect model matrix is rank deficient so dropping 8 columns / coefficients
2.4 plots
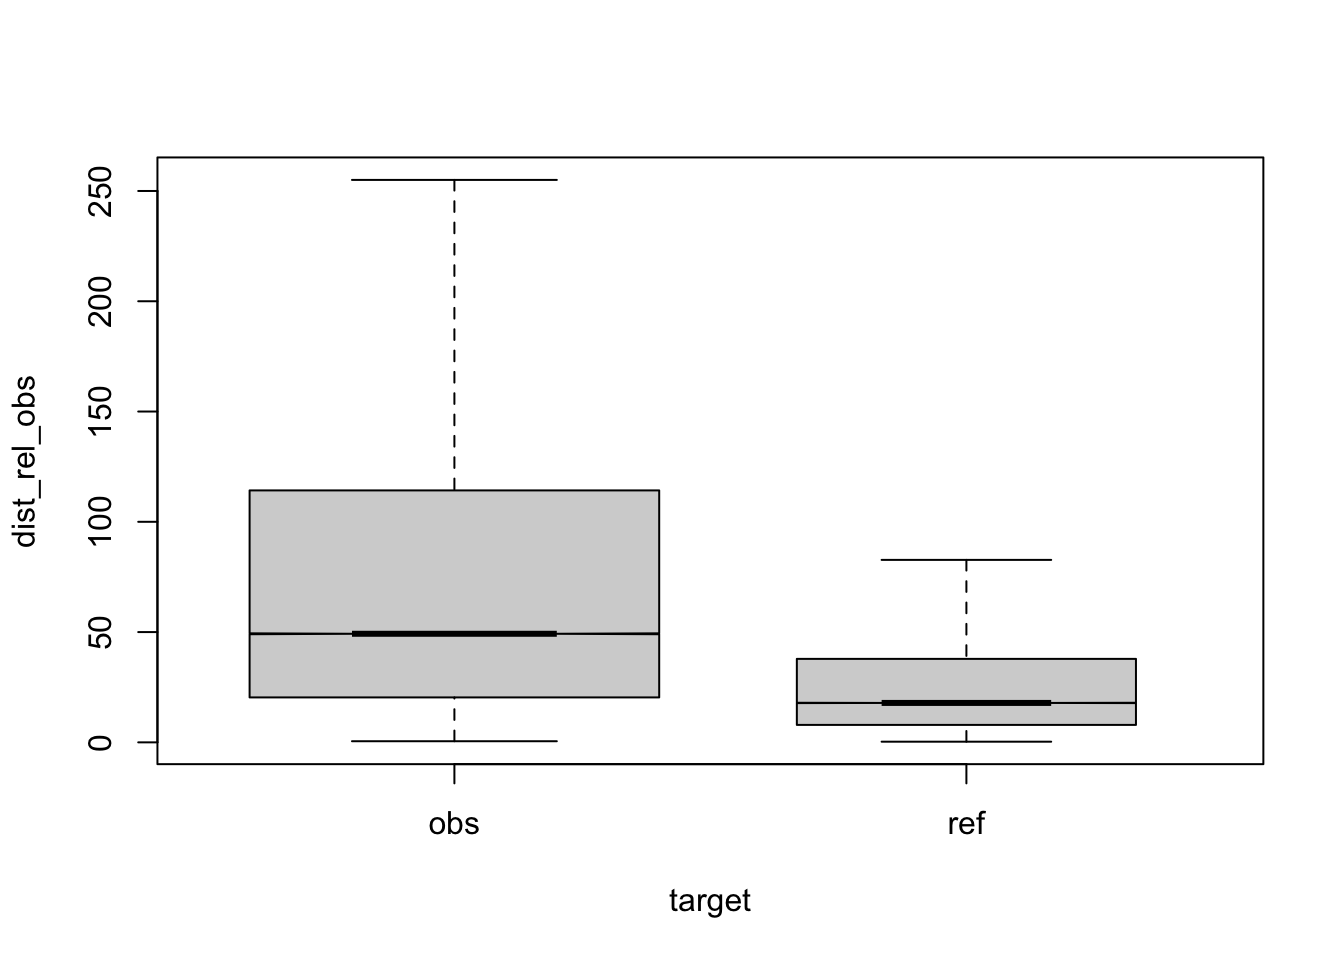
Figure 2.1: compare distances by corpus, normalised to obs, distance ceiling = outliers removed
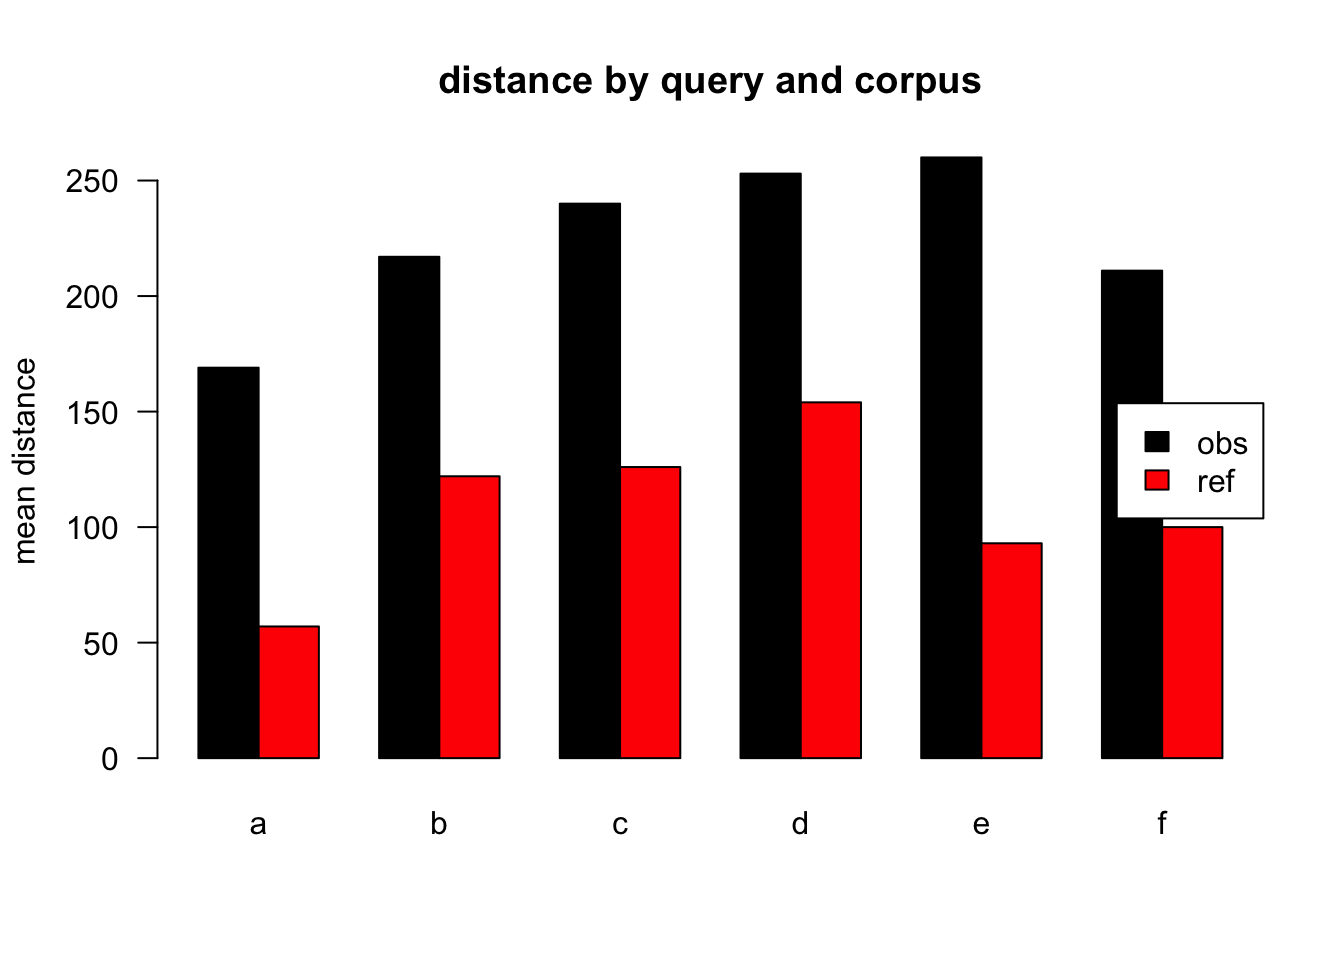
Figure 2.2: mean distances over query/corpus, normalised to obs, distance ceiling = outliers removed
| target | q | n | mean | median |
|---|---|---|---|---|
| obs | a | 557479 | 169 | 77 |
| ref | a | 394838 | 57 | 25 |
| obs | b | 5904 | 217 | 120 |
| ref | b | 747 | 122 | 44 |
| obs | c | 26883 | 240 | 138 |
| ref | c | 1033 | 126 | 73 |
| obs | d | 25400 | 253 | 149 |
| ref | d | 1041 | 154 | 106 |
| obs | e | 19228 | 260 | 149 |
| ref | e | 656 | 93 | 79 |
| obs | f | 11920 | 211 | 111 |
| ref | f | 26 | 100 | 126 |
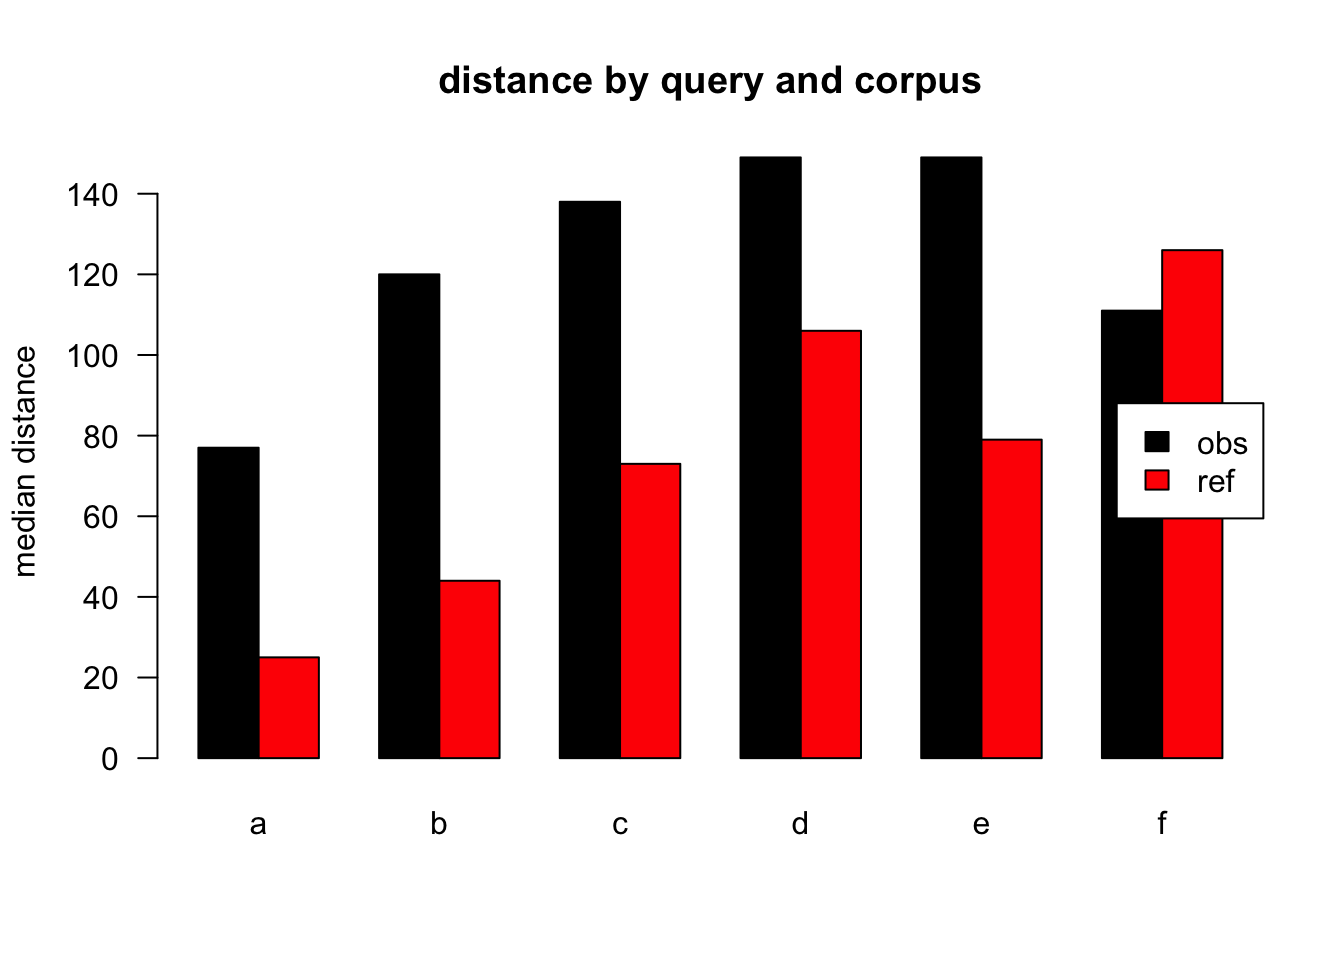
Figure 2.3: median distances over query/corpus, normalised to obs, distance ceiling = outliers removed
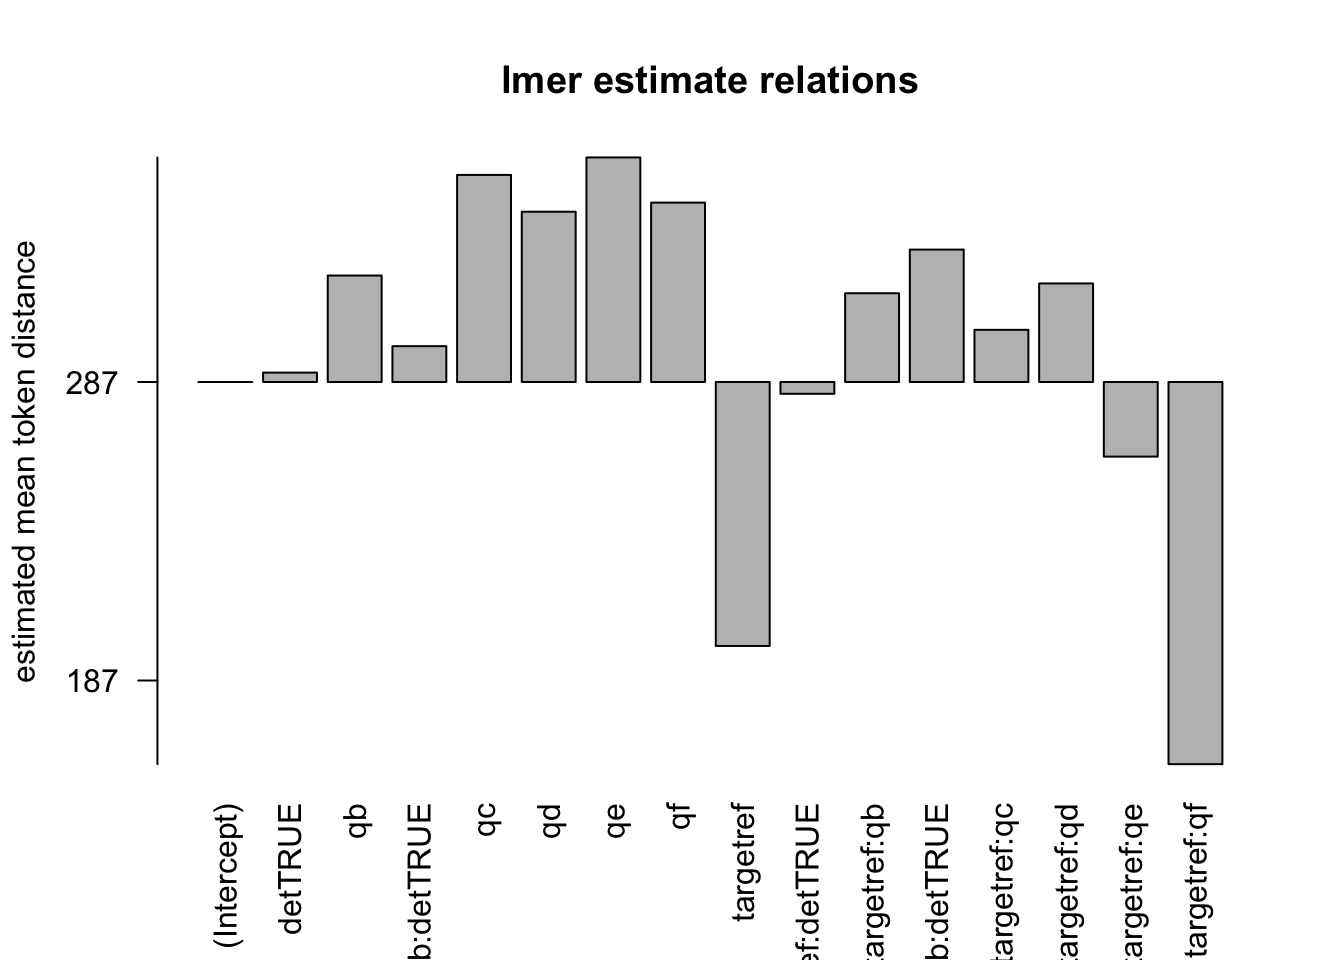
Figure 2.4: distances relation, normalised to obs, distance ceiling = outliers removed
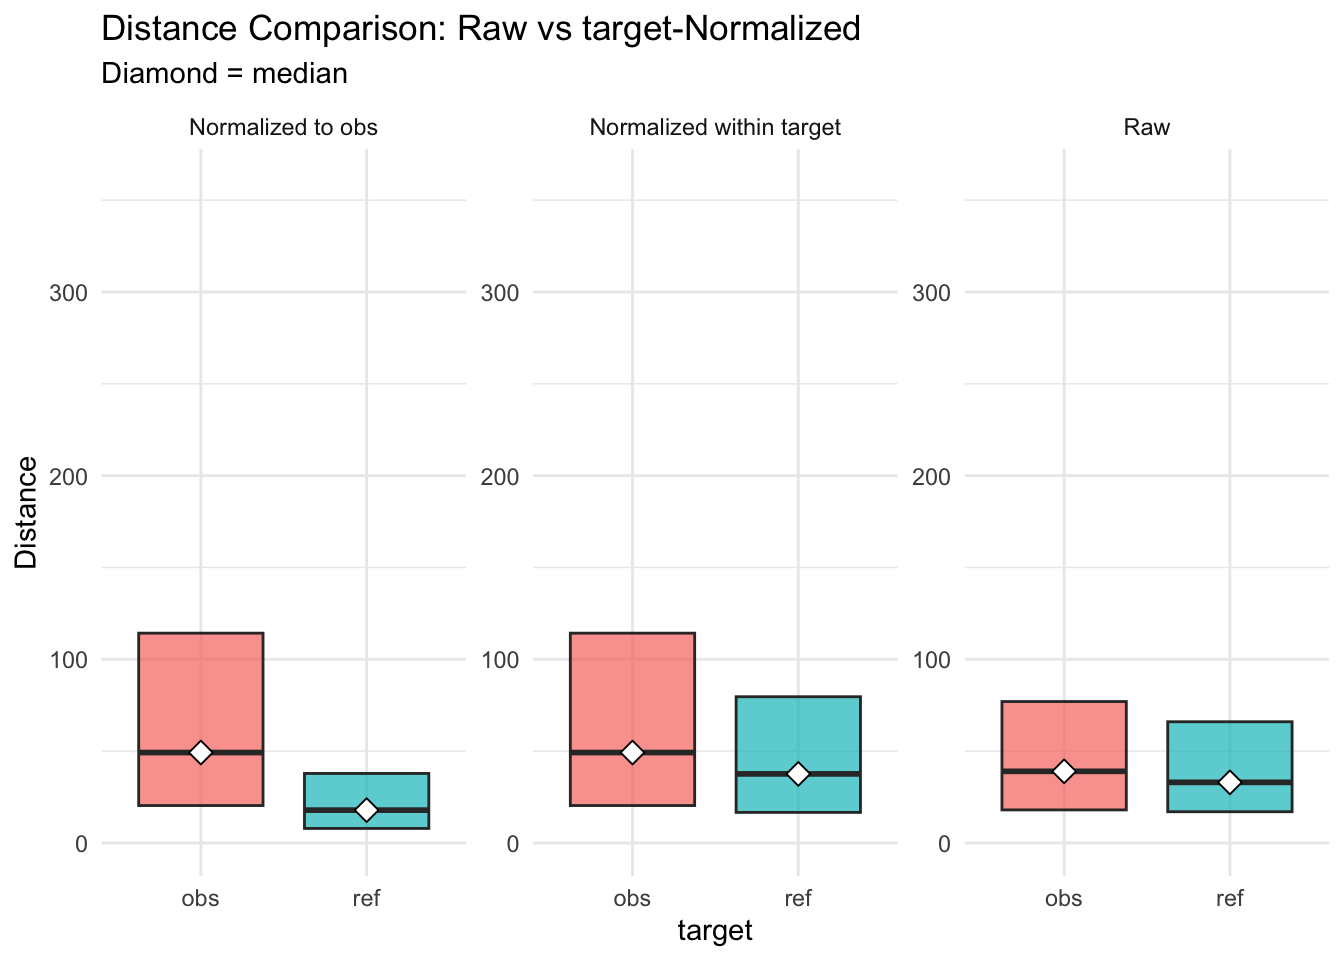
Figure 2.5: distances normalised vs. raw