3 appendix
overall wordcount of paper: 3071.
3.1 legende
| variable | explanation | values |
|---|---|---|
| target | corpus | obs,ref |
| q | condition | a,b,c,d,e,f |
| det | antecedent POS==DET | TRUE,FALSE |
| aut_id | author | author hash |
| lemma | lemma | noun lemma |
| range | url range of distance devised | 1..maxlength(urlthread) |
| embed.score | semantic similarity score lemma vs. thread | 0..1 |
| q:a | query condition | .* |
| q:b | query condition | this,that,those,these |
| q:c | query condition | the |
| q:d | query condition | a,an,any,some |
| q:e | query condition | my |
| q:f | query condition | his,her,their,your |
3.2 evaluation model: 1
3.2.2 parameter setting
##                value
## norm_target _rel_obs
## det.t           TRUE
## limit           TRUE
## author          TRUE
## url             TRUE
## embed1          TRUE
## embed2             f
## range1          TRUE
## range2             f
## rel             TRUE
## lme            FALSE
## lemma          FALSE
3.2.3 anova analysis
3.2.3.1 anova plain
formula: [dist_rel_obs ~ target*q*det]
##                  Df     Sum Sq   Mean Sq   F value    Pr(>F)
## target            1  452303747 452303747 7336.4625 < 2.2e-16 ***
## q                 5   12320667   2464133   39.9688 < 2.2e-16 ***
## det               1    1636109   1636109   26.5380 2.588e-07 ***
## target:q          5    2747371    549474    8.9126 1.786e-08 ***
## target:det        1     251297    251297    4.0761  0.043496 *
## q:det             2     905292    452646    7.3420  0.000648 ***
## target:q:det      1     717222    717222   11.6335  0.000648 ***
## Residuals    126209 7780971239     61651
## ---
## Signif. codes:  0 '***' 0.001 '**' 0.01 '*' 0.05 '.' 0.1 ' ' 1
3.2.3.2 anova of linear regression model
[anova(summary(lmer))]
## Type III Analysis of Variance Table with Satterthwaite's method
##                Sum Sq  Mean Sq NumDF  DenDF   F value    Pr(>F)
## target        1144219  1144219     1   3519   23.4567 1.333e-06 ***
## q              737483   147497     5 122421    3.0237 0.0098706 **
## det             12165    12165     1 118425    0.2494 0.6175055
## range        50399647 50399647     1   1025 1033.2042 < 2.2e-16 ***
## embed.score  25101881 25101881     1 122690  514.5942 < 2.2e-16 ***
## target:q       776335   155267     5 123486    3.1830 0.0070933 **
## target:det     541078   541078     1 123325   11.0922 0.0008672 ***
## q:det          359520   179760     2 120804    3.6851 0.0250971 *
## target:q:det   219844   219844     1 123315    4.5068 0.0337615 *
## ---
## Signif. codes:  0 '***' 0.001 '**' 0.01 '*' 0.05 '.' 0.1 ' ' 1
3.2.3.3 linear regression coefficients
formula: [dist_rel_obs ~ target*q*det+(1|aut_id)+range+(embed.score)+(1|url_id)]
## Linear mixed model fit by REML. t-tests use Satterthwaite's method [
## lmerModLmerTest]
## Formula: eval(expr(lmeform))
##    Data: dfa
##
## REML criterion at convergence: 1727639
##
## Scaled residuals:
##     Min      1Q  Median      3Q     Max
## -2.8643 -0.5282 -0.1721  0.2469  6.9244
##
## Random effects:
##  Groups   Name        Variance Std.Dev.
##  aut_id   (Intercept)  2856     53.44
##  url_id   (Intercept)  8187     90.48
##  Residual             48780    220.86
## Number of obs: 126226, groups:  aut_id, 8238; url_id, 2145
##
## Fixed effects:
##                    Estimate Std. Error         df t value Pr(>|t|)
## (Intercept)       4.625e+02  5.159e+00  8.969e+03  89.651  < 2e-16 ***
## targetref        -4.342e+01  6.299e+00  1.300e+03  -6.893 8.50e-12 ***
## qb               -2.013e+01  1.527e+01  1.218e+05  -1.318 0.187483
## qc               -2.207e+01  5.499e+00  1.226e+05  -4.014 5.98e-05 ***
## qd               -3.178e+01  2.225e+02  1.184e+05  -0.143 0.886426
## qe                2.492e+01  3.835e+00  1.247e+05   6.498 8.14e-11 ***
## qf               -1.891e+01  4.892e+00  1.244e+05  -3.866 0.000111 ***
## det               1.273e+01  4.774e+00  1.229e+05   2.667 0.007662 **
## range            -5.810e-02  1.808e-03  1.025e+03 -32.143  < 2e-16 ***
## embed.score      -1.829e+02  8.061e+00  1.227e+05 -22.685  < 2e-16 ***
## targetref:qb      1.862e+01  1.719e+01  1.225e+05   1.083 0.278599
## targetref:qc      2.281e+01  1.279e+01  1.237e+05   1.784 0.074435 .
## targetref:qd      4.413e-01  1.254e+01  1.238e+05   0.035 0.971935
## targetref:qe     -2.321e+01  9.511e+00  1.239e+05  -2.441 0.014662 *
## targetref:qf      1.801e+01  1.210e+01  1.238e+05   1.488 0.136766
## targetref:det    -1.478e+01  1.084e+01  1.239e+05  -1.363 0.172784
## qb:det            5.915e+01  1.678e+01  1.219e+05   3.526 0.000423 ***
## qd:det            3.648e+01  2.225e+02  1.184e+05   0.164 0.869736
## targetref:qb:det -5.198e+01  2.448e+01  1.233e+05  -2.123 0.033761 *
## ---
## Signif. codes:  0 '***' 0.001 '**' 0.01 '*' 0.05 '.' 0.1 ' ' 1
## fit warnings:
## fixed-effect model matrix is rank deficient so dropping 7 columns / coefficients
## Some predictor variables are on very different scales: consider rescaling
3.2.4 plots
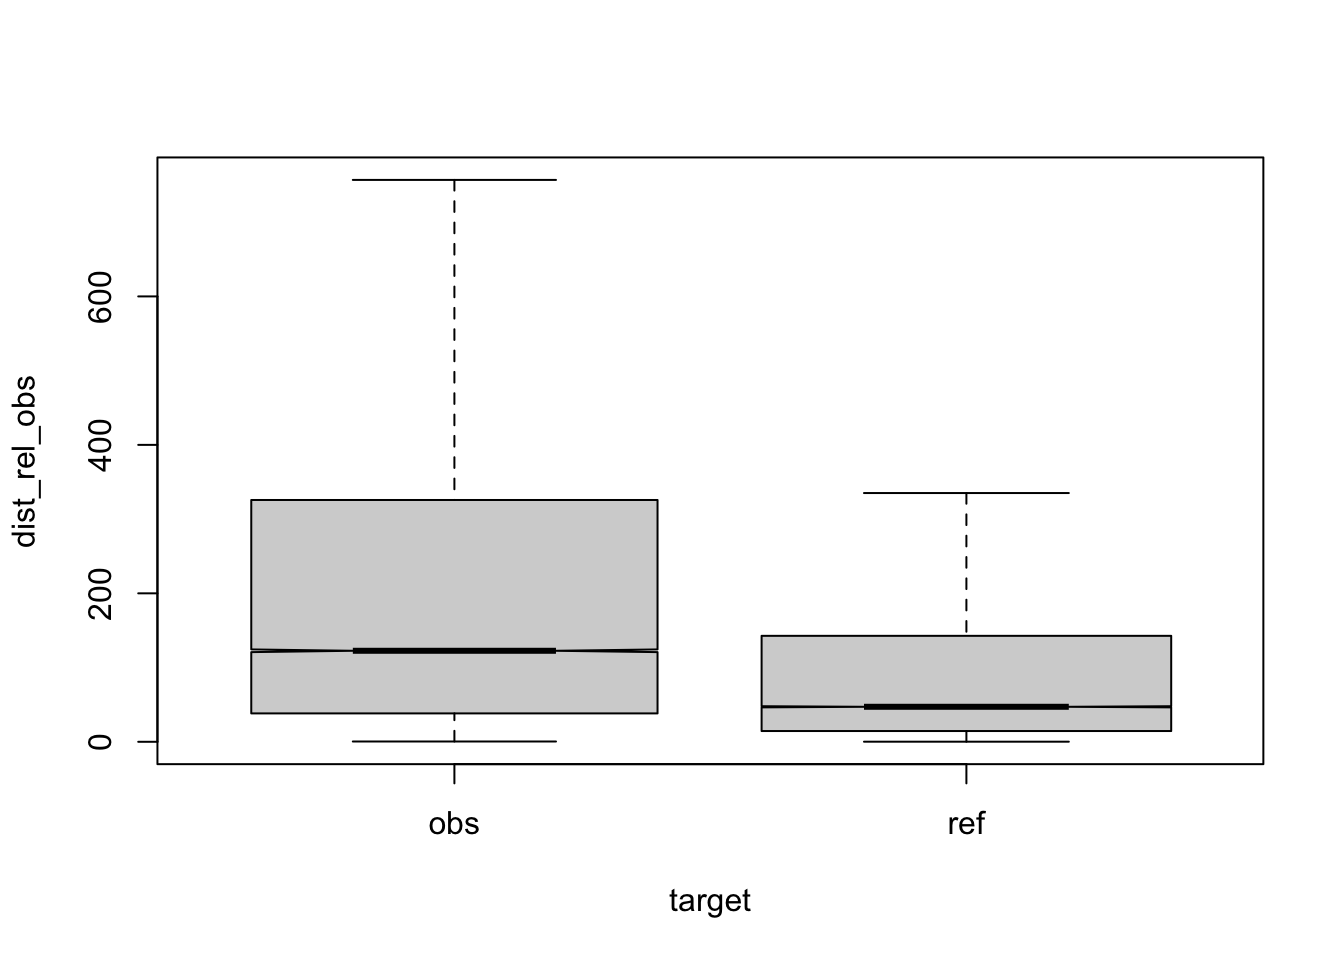
Figure 3.1: compare distances by corpus, normalised to obs, distance ceiling = outliers removed
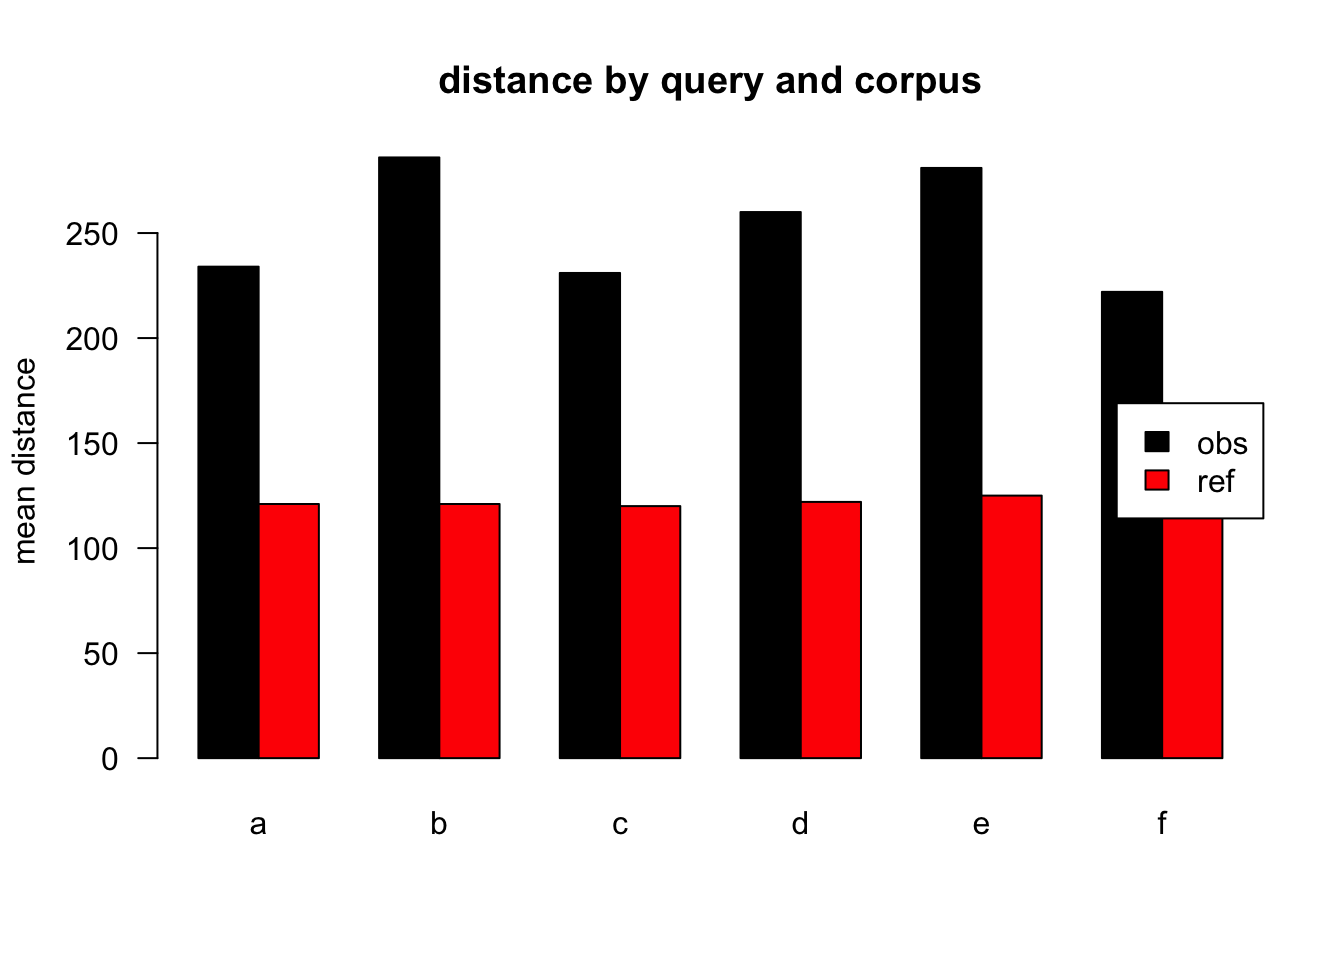
Figure 3.2: mean distances over query/corpus, normalised to obs, distance ceiling = outliers removed
| target | q | n | mean | median |
|---|---|---|---|---|
| obs | a | 42836 | 234 | 117 |
| ref | a | 58615 | 121 | 47 |
| obs | b | 2116 | 286 | 165 |
| ref | b | 1130 | 121 | 44 |
| obs | c | 5770 | 231 | 114 |
| ref | c | 1274 | 120 | 48 |
| obs | d | 5654 | 260 | 144 |
| ref | d | 1525 | 122 | 49 |
| obs | e | 3911 | 281 | 147 |
| ref | e | 671 | 125 | 45 |
| obs | f | 2311 | 222 | 133 |
| ref | f | 413 | 116 | 47 |
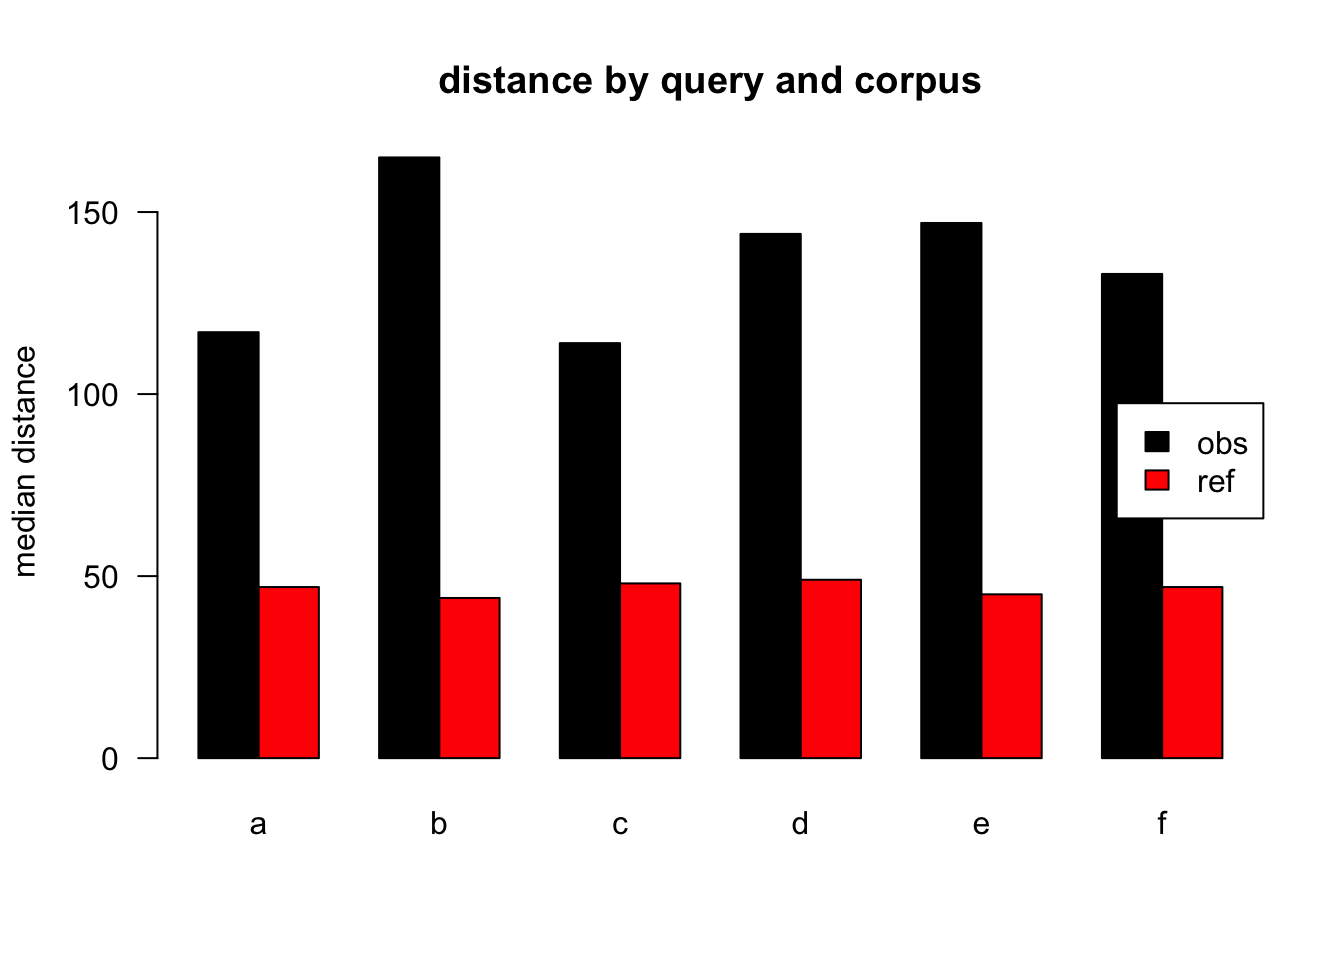
Figure 3.3: median distances over query/corpus, normalised to obs, distance ceiling = outliers removed

Figure 3.4: distances relation, normalised to obs, distance ceiling = outliers removed
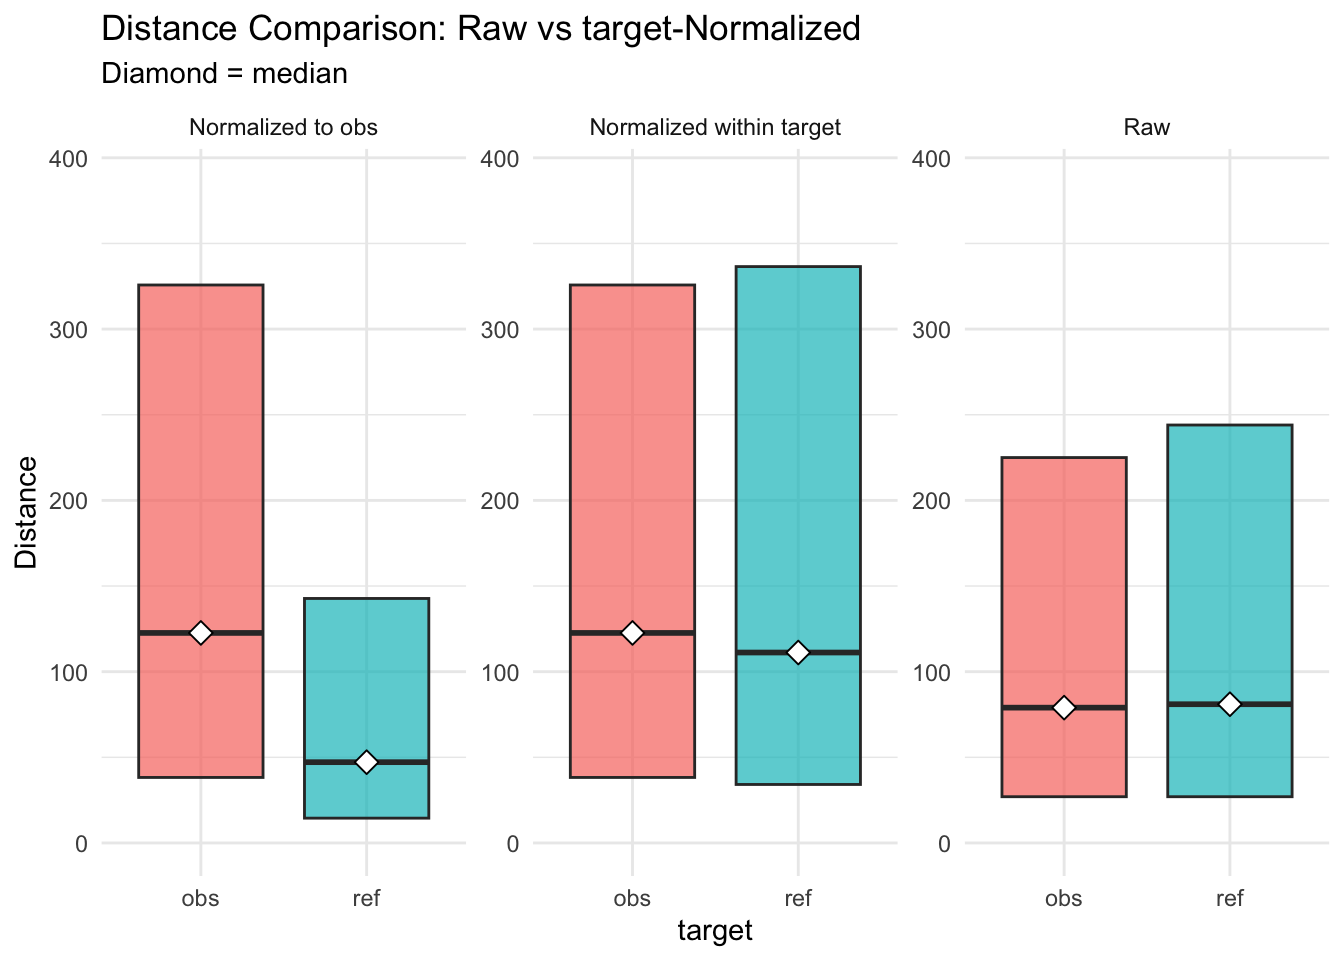
Figure 3.5: distances normalised vs. raw
3.3 evaluation model: 2
3.3.2 parameter setting
##             value
## norm_target
## det.t        TRUE
## limit       FALSE
## author       TRUE
## url          TRUE
## embed1       TRUE
## embed2          f
## range1       TRUE
## range2          f
## rel         FALSE
## lme         FALSE
## lemma       FALSE
3.3.3 anova analysis
3.3.3.1 anova plain
formula: [dist ~ target*q*det]
##                  Df     Sum Sq    Mean Sq  F value  Pr(>F)
## target            1 1.1152e+11 1.1152e+11 268.8154 < 2e-16 ***
## q                 5 9.8792e+08 1.9758e+08   0.4763 0.79425
## det               1 4.1537e+08 4.1537e+08   1.0012 0.31702
## target:q          5 2.3050e+09 4.6101e+08   1.1112 0.35184
## target:det        1 2.7199e+09 2.7199e+09   6.5561 0.01045 *
## q:det             2 2.4028e+08 1.2014e+08   0.2896 0.74857
## target:q:det      1 7.0024e+06 7.0024e+06   0.0169 0.89663
## Residuals    142304 5.9037e+13 4.1487e+08
## ---
## Signif. codes:  0 '***' 0.001 '**' 0.01 '*' 0.05 '.' 0.1 ' ' 1
3.3.3.2 anova of linear regression model
[anova(summary(lmer))]
## Type III Analysis of Variance Table with Satterthwaite's method
##                  Sum Sq    Mean Sq NumDF  DenDF  F value  Pr(>F)
## target       1.2717e+09 1.2717e+09     1   3751   5.5781 0.01824 *
## q            6.3534e+08 1.2707e+08     5 137654   0.5574 0.73281
## det          7.3359e+05 7.3359e+05     1 133172   0.0032 0.95476
## range        2.8637e+07 2.8637e+07     1   2113   0.1256 0.72306
## embed.score  2.7199e+10 2.7199e+10     1 141732 119.3005 < 2e-16 ***
## target:q     3.0753e+09 6.1507e+08     5 138840   2.6979 0.01920 *
## target:det   8.1028e+08 8.1028e+08     1 138434   3.5541 0.05940 .
## q:det        4.8717e+08 2.4358e+08     2 135770   1.0684 0.34355
## target:q:det 2.4585e+06 2.4585e+06     1 138496   0.0108 0.91729
## ---
## Signif. codes:  0 '***' 0.001 '**' 0.01 '*' 0.05 '.' 0.1 ' ' 1
3.3.3.3 linear regression coefficients
formula: [dist ~ target*q*det+(1|aut_id)+range+(embed.score)+(1|url_id)]
## Linear mixed model fit by REML. t-tests use Satterthwaite's method [
## lmerModLmerTest]
## Formula: eval(expr(lmeform))
##    Data: dfa
##
## REML criterion at convergence: 3153644
##
## Scaled residuals:
##     Min      1Q  Median      3Q     Max
## -23.760  -0.034  -0.006   0.025  55.672
##
## Random effects:
##  Groups   Name        Variance  Std.Dev.
##  aut_id   (Intercept)  28985985  5384
##  url_id   (Intercept)  98381104  9919
##  Residual             227983636 15099
## Number of obs: 142321, groups:  aut_id, 8395; url_id, 2145
##
## Fixed effects:
##                    Estimate Std. Error         df t value Pr(>|t|)
## (Intercept)       2.873e+03  4.211e+02  8.594e+03   6.823 9.53e-12 ***
## targetref         1.341e+03  6.536e+02  2.412e+03   2.051   0.0404 *
## qb                6.895e+01  1.008e+03  1.363e+05   0.068   0.9454
## qc               -6.307e+02  3.622e+02  1.372e+05  -1.741   0.0816 .
## qd               -1.993e+03  1.522e+04  1.332e+05  -0.131   0.8958
## qe               -1.006e+02  2.520e+02  1.385e+05  -0.399   0.6899
## qf               -1.355e+02  3.218e+02  1.384e+05  -0.421   0.6737
## det               7.031e+02  3.145e+02  1.375e+05   2.236   0.0254 *
## range             6.798e-02  1.918e-01  2.113e+03   0.354   0.7231
## embed.score      -5.793e+03  5.304e+02  1.417e+05 -10.922  < 2e-16 ***
## targetref:qb      6.675e+02  1.124e+03  1.371e+05   0.594   0.5527
## targetref:qc      3.752e+01  8.128e+02  1.395e+05   0.046   0.9632
## targetref:qd      2.022e+03  7.989e+02  1.395e+05   2.531   0.0114 *
## targetref:qe      2.269e+02  6.042e+02  1.395e+05   0.376   0.7073
## targetref:qf      3.210e+02  7.643e+02  1.393e+05   0.420   0.6745
## targetref:det    -1.416e+03  6.890e+02  1.397e+05  -2.055   0.0398 *
## qb:det           -1.077e+03  1.107e+03  1.364e+05  -0.973   0.3304
## qd:det            1.039e+03  1.521e+04  1.332e+05   0.068   0.9456
## targetref:qb:det -1.651e+02  1.590e+03  1.385e+05  -0.104   0.9173
## ---
## Signif. codes:  0 '***' 0.001 '**' 0.01 '*' 0.05 '.' 0.1 ' ' 1
## fit warnings:
## fixed-effect model matrix is rank deficient so dropping 7 columns / coefficients
## Some predictor variables are on very different scales: consider rescaling
3.3.4 plots
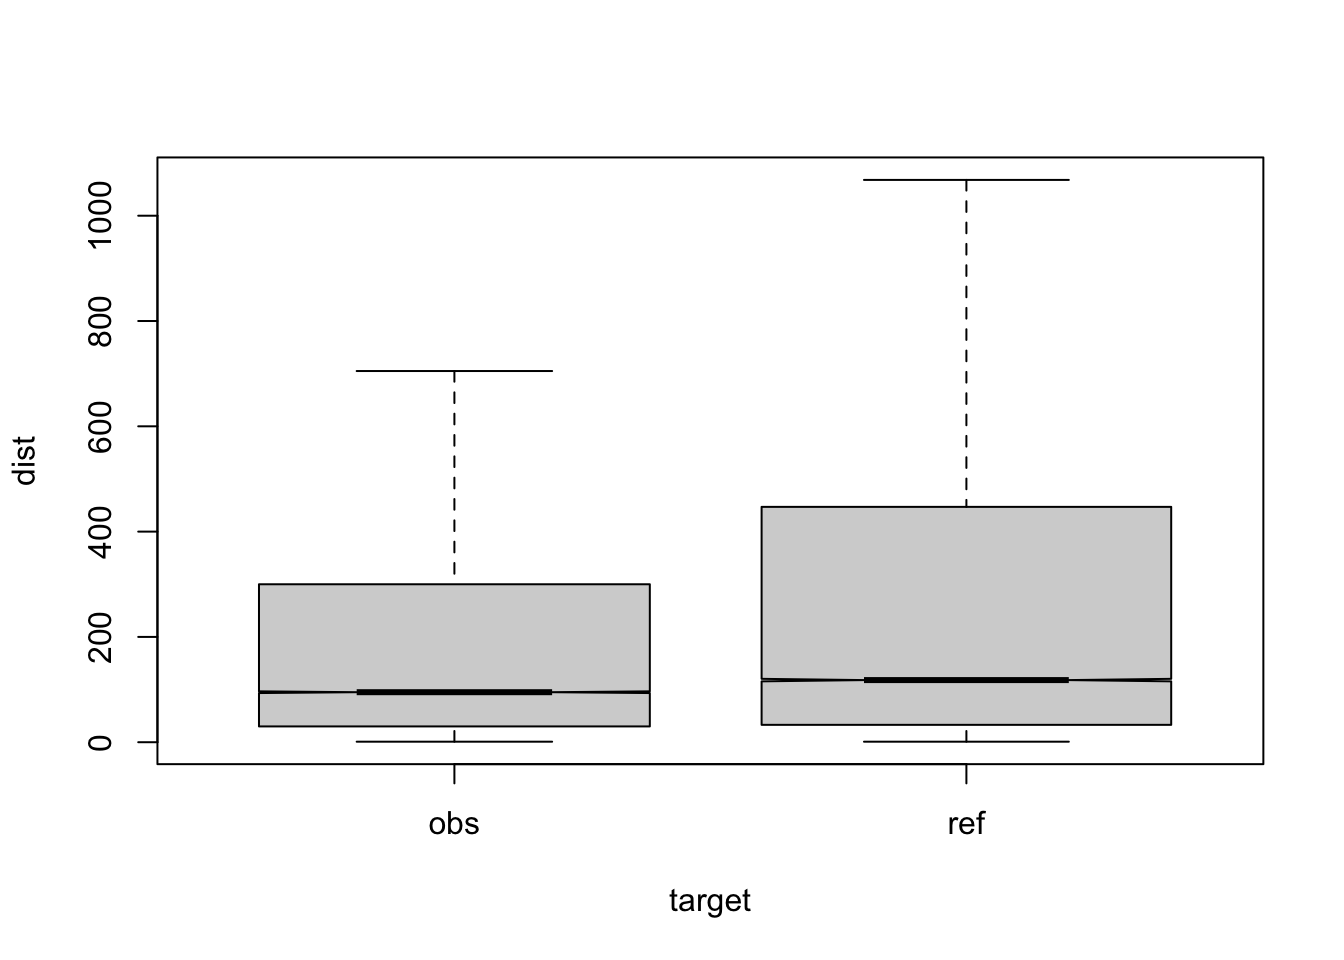
Figure 3.6: compare distances by corpus, not normalised, distance ceiling =outliers not removed
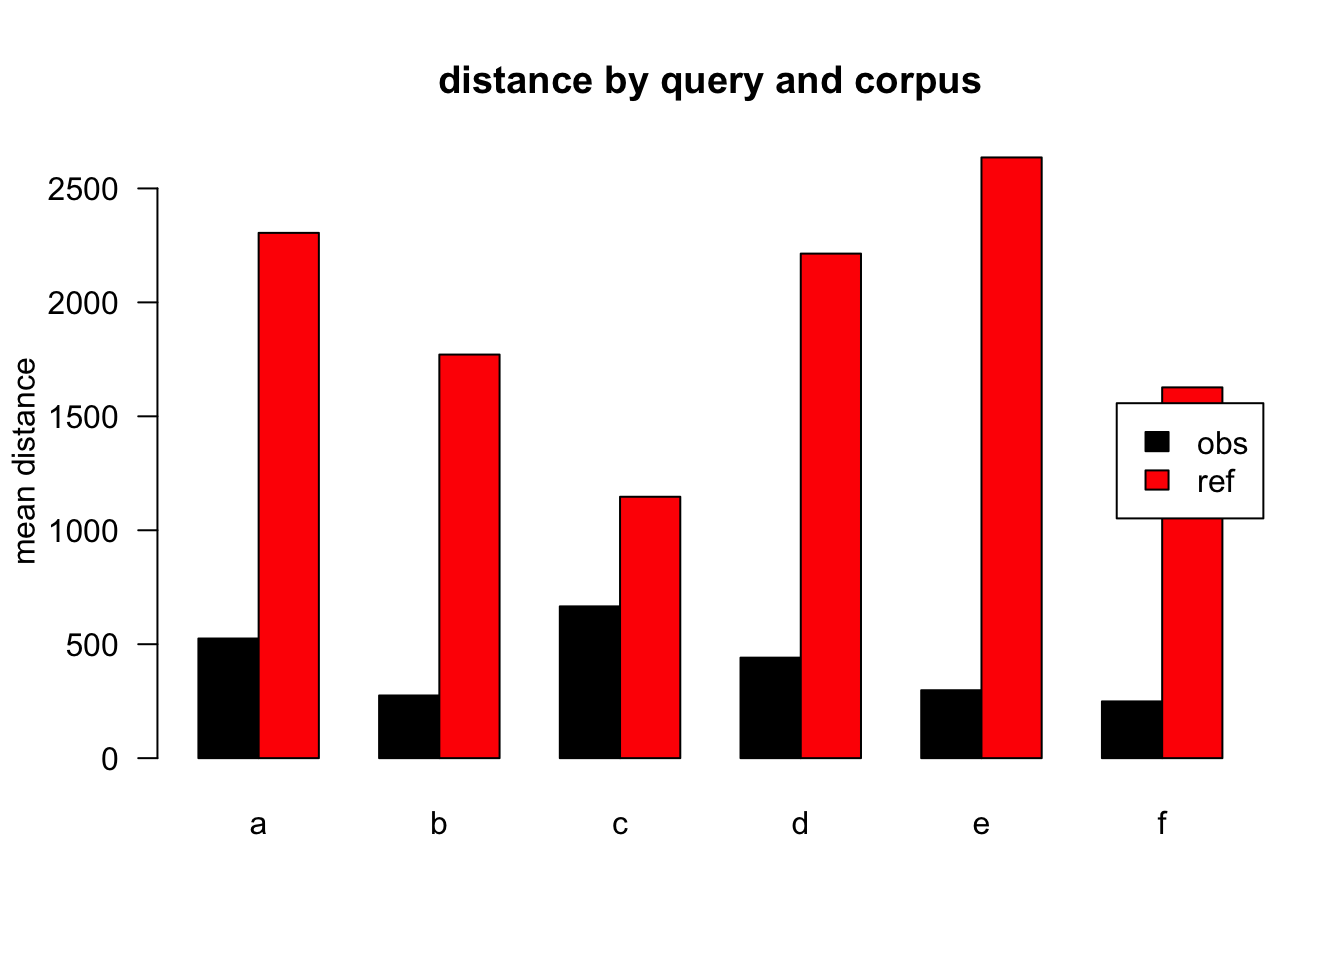
Figure 3.7: mean distances over query/corpus, not normalised, distance ceiling =outliers not removed
| target | q | n | mean | median |
|---|---|---|---|---|
| obs | a | 46318 | 525 | 92 |
| ref | a | 68618 | 2305 | 118 |
| obs | b | 2287 | 275 | 109 |
| ref | b | 1315 | 1771 | 111 |
| obs | c | 6253 | 666 | 89 |
| ref | c | 1504 | 1147 | 119 |
| obs | d | 6171 | 441 | 105 |
| ref | d | 1765 | 2214 | 124 |
| obs | e | 4278 | 298 | 109 |
| ref | e | 795 | 2636 | 116 |
| obs | f | 2520 | 249 | 77 |
| ref | f | 497 | 1627 | 124 |
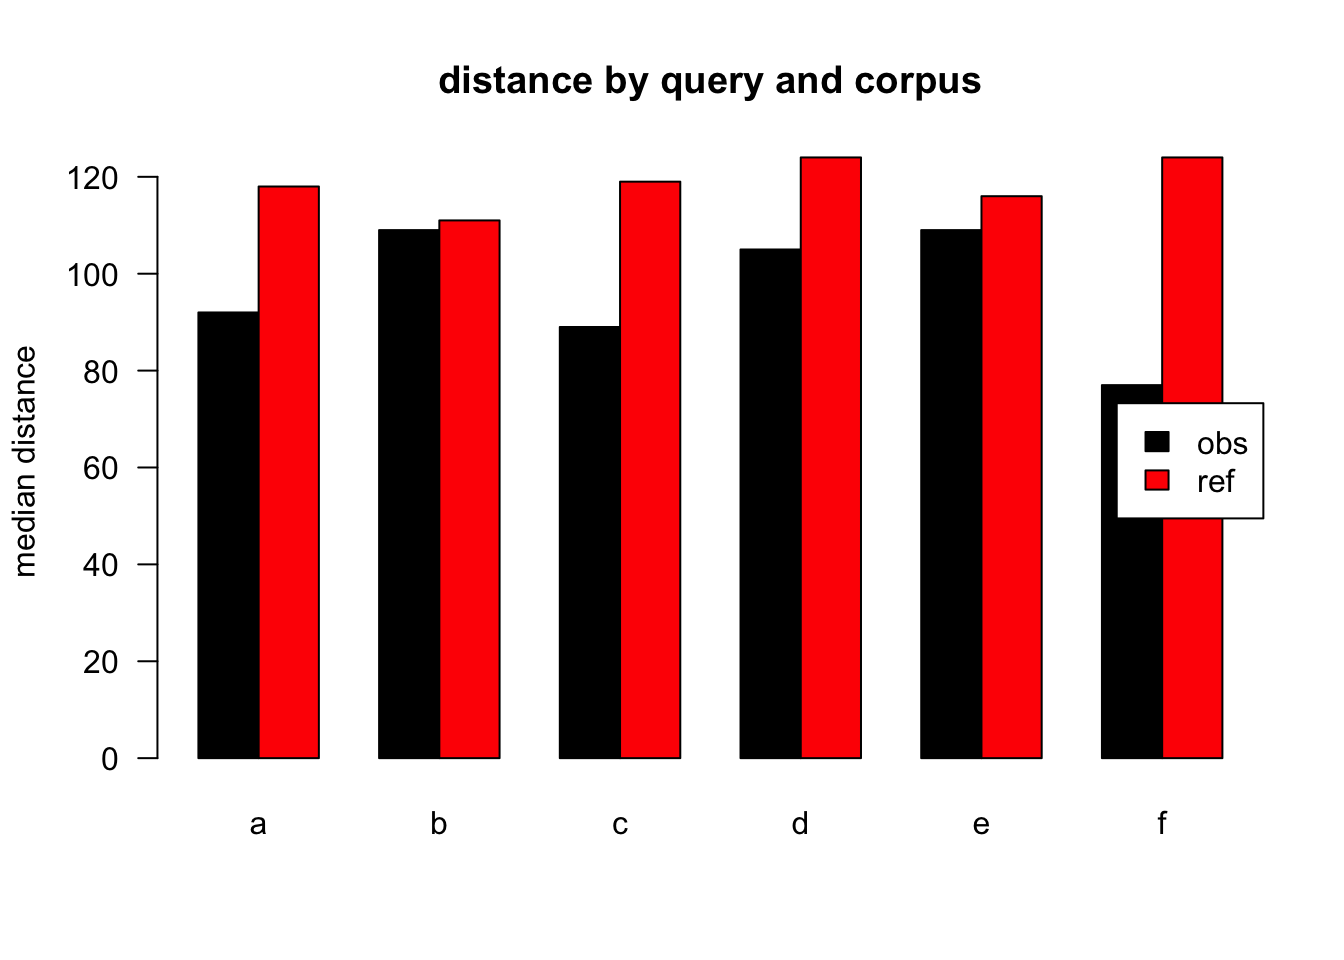
Figure 3.8: median distances over query/corpus, not normalised, distance ceiling =outliers not removed
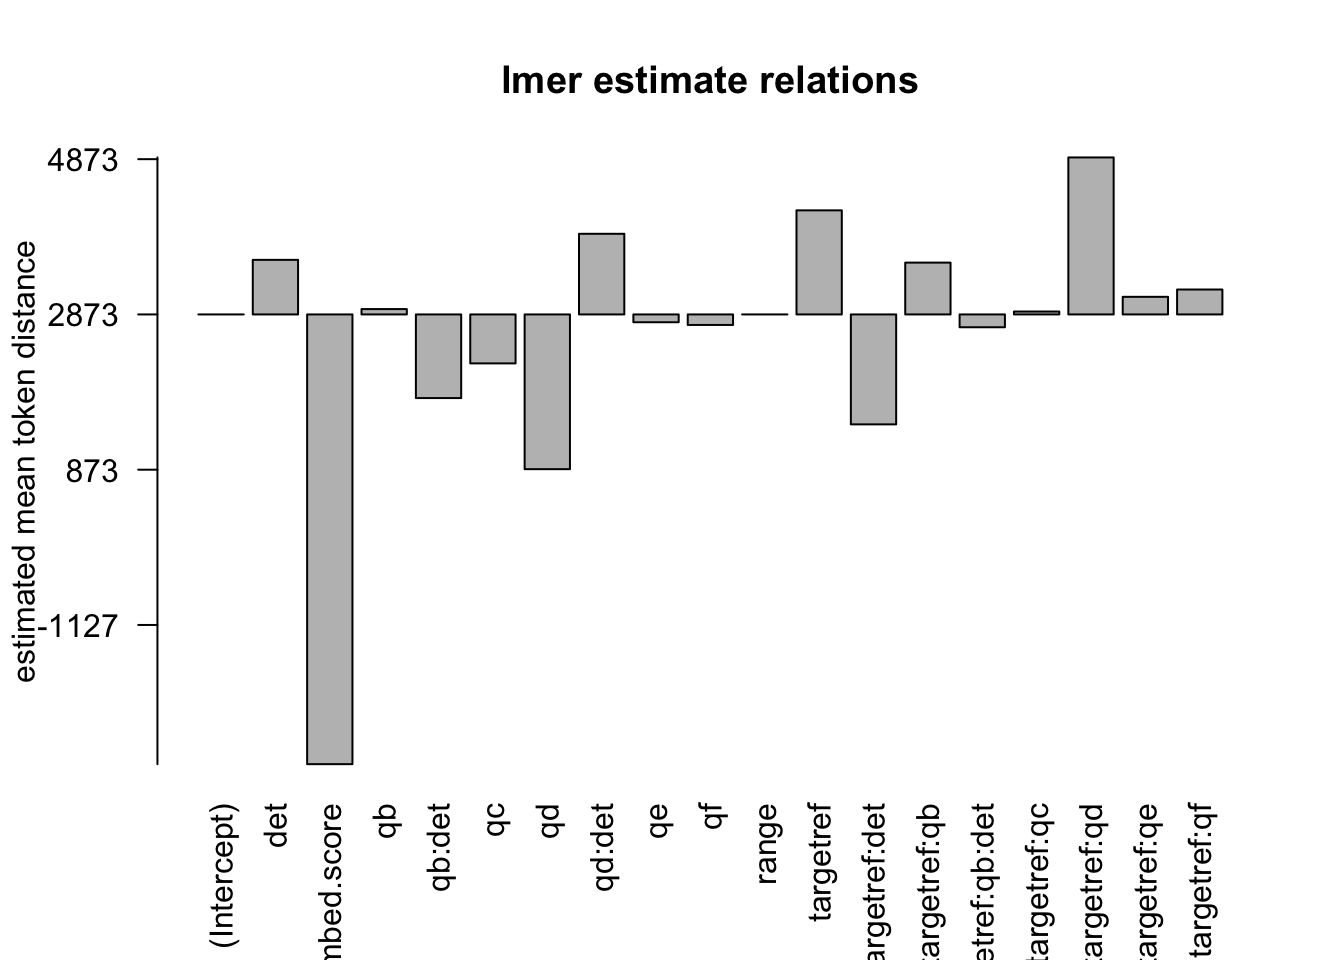
Figure 3.9: distances relation, not normalised, distance ceiling =outliers not removed
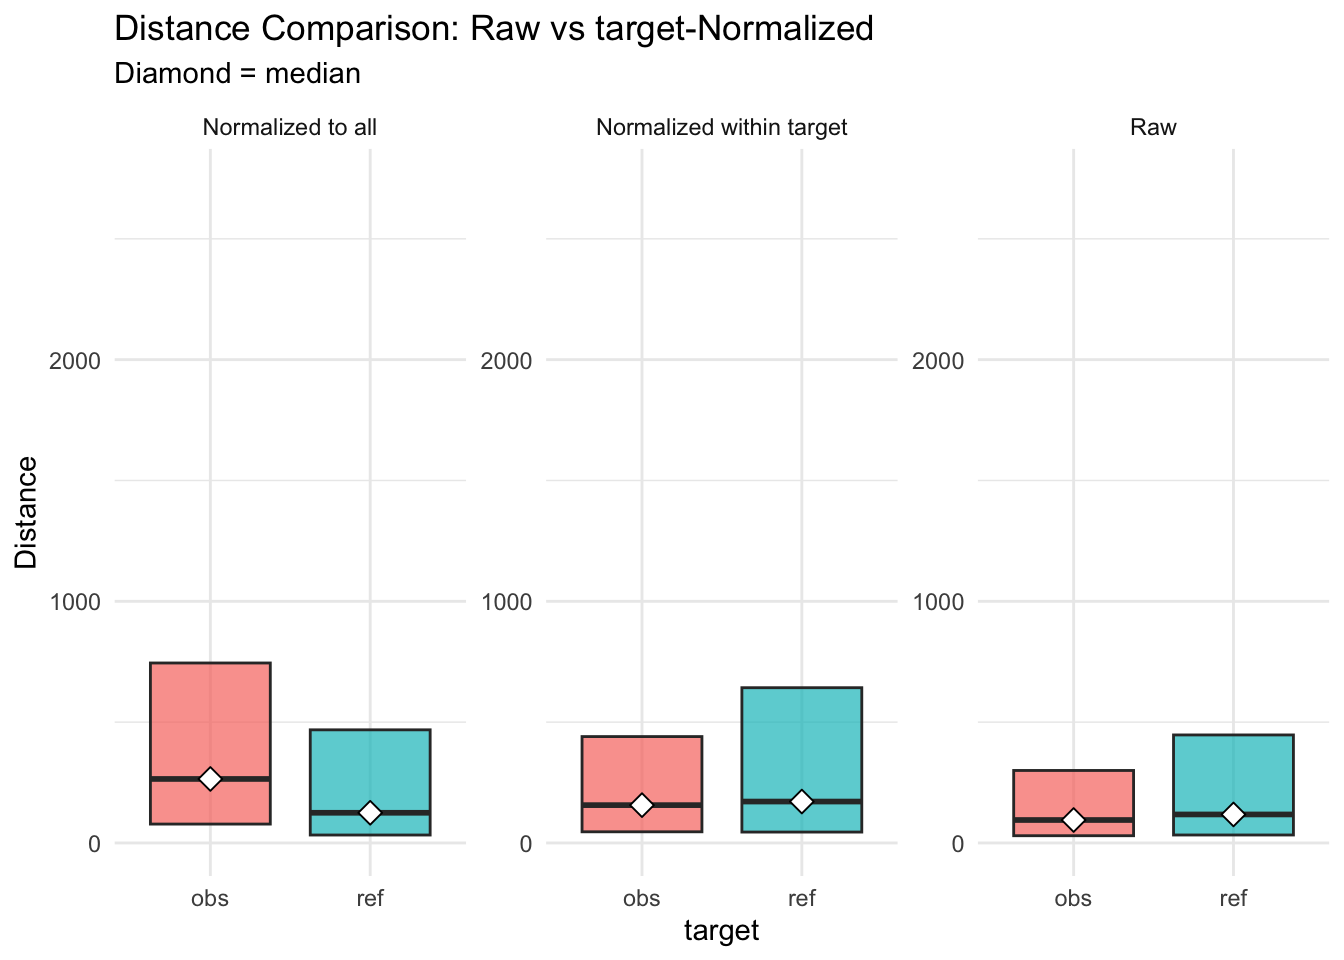
Figure 3.10: distances normalised vs. raw
3.4 evaluation model: 3
3.4.2 parameter setting
##                value
## norm_target _rel_all
## det.t           TRUE
## limit           TRUE
## author          TRUE
## url             TRUE
## embed1          TRUE
## embed2             f
## range1          TRUE
## range2             f
## rel             TRUE
## lme            FALSE
## lemma          FALSE
3.4.3 anova analysis
3.4.3.1 anova plain
formula: [dist_rel_all ~ target*q*det]
##                  Df     Sum Sq    Mean Sq   F value    Pr(>F)
## target            1 1.2830e+09 1283010757 7336.4625 < 2.2e-16 ***
## q                 5 3.4949e+07    6989793   39.9688 < 2.2e-16 ***
## det               1 4.6410e+06    4641007   26.5380 2.588e-07 ***
## target:q          5 7.7932e+06    1558646    8.9126 1.786e-08 ***
## target:det        1 7.1283e+05     712833    4.0761  0.043496 *
## q:det             2 2.5680e+06    1283981    7.3420  0.000648 ***
## target:q:det      1 2.0345e+06    2034482   11.6335  0.000648 ***
## Residuals    126209 2.2072e+10     174881
## ---
## Signif. codes:  0 '***' 0.001 '**' 0.01 '*' 0.05 '.' 0.1 ' ' 1
3.4.3.2 anova of linear regression model
[anova(summary(lmer))]
## Type III Analysis of Variance Table with Satterthwaite's method
##                 Sum Sq   Mean Sq NumDF  DenDF   F value    Pr(>F)
## target         3245706   3245706     1   3519   23.4567 1.333e-06 ***
## q              2091953    418391     5 122421    3.0237 0.0098706 **
## det              34508     34508     1 118425    0.2494 0.6175055
## range        142964301 142964301     1   1025 1033.2042 < 2.2e-16 ***
## embed.score   71204325  71204325     1 122690  514.5942 < 2.2e-16 ***
## target:q       2202162    440432     5 123486    3.1830 0.0070933 **
## target:det     1534830   1534830     1 123325   11.0922 0.0008672 ***
## q:det          1019818    509909     2 120804    3.6851 0.0250971 *
## target:q:det    623611    623611     1 123315    4.5068 0.0337615 *
## ---
## Signif. codes:  0 '***' 0.001 '**' 0.01 '*' 0.05 '.' 0.1 ' ' 1
3.4.3.3 linear regression coefficients
formula: [dist_rel_all ~ target*q*det+(1|aut_id)+range+(embed.score)+(1|url_id)]
## Linear mixed model fit by REML. t-tests use Satterthwaite's method [
## lmerModLmerTest]
## Formula: eval(expr(lmeform))
##    Data: dfa
##
## REML criterion at convergence: 1859224
##
## Scaled residuals:
##     Min      1Q  Median      3Q     Max
## -2.8643 -0.5282 -0.1721  0.2469  6.9244
##
## Random effects:
##  Groups   Name        Variance Std.Dev.
##  aut_id   (Intercept)   8101    90.01
##  url_id   (Intercept)  23223   152.39
##  Residual             138370   371.98
## Number of obs: 126226, groups:  aut_id, 8238; url_id, 2145
##
## Fixed effects:
##                    Estimate Std. Error         df t value Pr(>|t|)
## (Intercept)       7.789e+02  8.688e+00  8.969e+03  89.651  < 2e-16 ***
## targetref        -7.312e+01  1.061e+01  1.300e+03  -6.893 8.50e-12 ***
## qb               -3.390e+01  2.572e+01  1.218e+05  -1.318 0.187483
## qc               -3.717e+01  9.261e+00  1.226e+05  -4.014 5.98e-05 ***
## qd               -5.353e+01  3.748e+02  1.184e+05  -0.143 0.886426
## qe                4.198e+01  6.460e+00  1.247e+05   6.498 8.14e-11 ***
## qf               -3.185e+01  8.240e+00  1.244e+05  -3.866 0.000111 ***
## det               2.144e+01  8.041e+00  1.229e+05   2.667 0.007662 **
## range            -9.786e-02  3.044e-03  1.025e+03 -32.143  < 2e-16 ***
## embed.score      -3.080e+02  1.358e+01  1.227e+05 -22.685  < 2e-16 ***
## targetref:qb      3.136e+01  2.894e+01  1.225e+05   1.083 0.278599
## targetref:qc      3.842e+01  2.154e+01  1.237e+05   1.784 0.074435 .
## targetref:qd      7.432e-01  2.113e+01  1.238e+05   0.035 0.971935
## targetref:qe     -3.910e+01  1.602e+01  1.239e+05  -2.441 0.014662 *
## targetref:qf      3.033e+01  2.039e+01  1.238e+05   1.488 0.136766
## targetref:det    -2.490e+01  1.826e+01  1.239e+05  -1.363 0.172784
## qb:det            9.962e+01  2.826e+01  1.219e+05   3.526 0.000423 ***
## qd:det            6.144e+01  3.747e+02  1.184e+05   0.164 0.869736
## targetref:qb:det -8.754e+01  4.124e+01  1.233e+05  -2.123 0.033761 *
## ---
## Signif. codes:  0 '***' 0.001 '**' 0.01 '*' 0.05 '.' 0.1 ' ' 1
## fit warnings:
## fixed-effect model matrix is rank deficient so dropping 7 columns / coefficients
## Some predictor variables are on very different scales: consider rescaling
3.4.4 plots

Figure 3.11: compare distances by corpus, normalised to all, distance ceiling = outliers removed

Figure 3.12: mean distances over query/corpus, normalised to all, distance ceiling = outliers removed
| target | q | n | mean | median |
|---|---|---|---|---|
| obs | a | 42836 | 395 | 196 |
| ref | a | 58615 | 203 | 79 |
| obs | b | 2116 | 481 | 279 |
| ref | b | 1130 | 204 | 75 |
| obs | c | 5770 | 388 | 191 |
| ref | c | 1274 | 203 | 80 |
| obs | d | 5654 | 437 | 243 |
| ref | d | 1525 | 205 | 83 |
| obs | e | 3911 | 473 | 248 |
| ref | e | 671 | 211 | 75 |
| obs | f | 2311 | 374 | 224 |
| ref | f | 413 | 195 | 79 |

Figure 3.13: median distances over query/corpus, normalised to all, distance ceiling = outliers removed
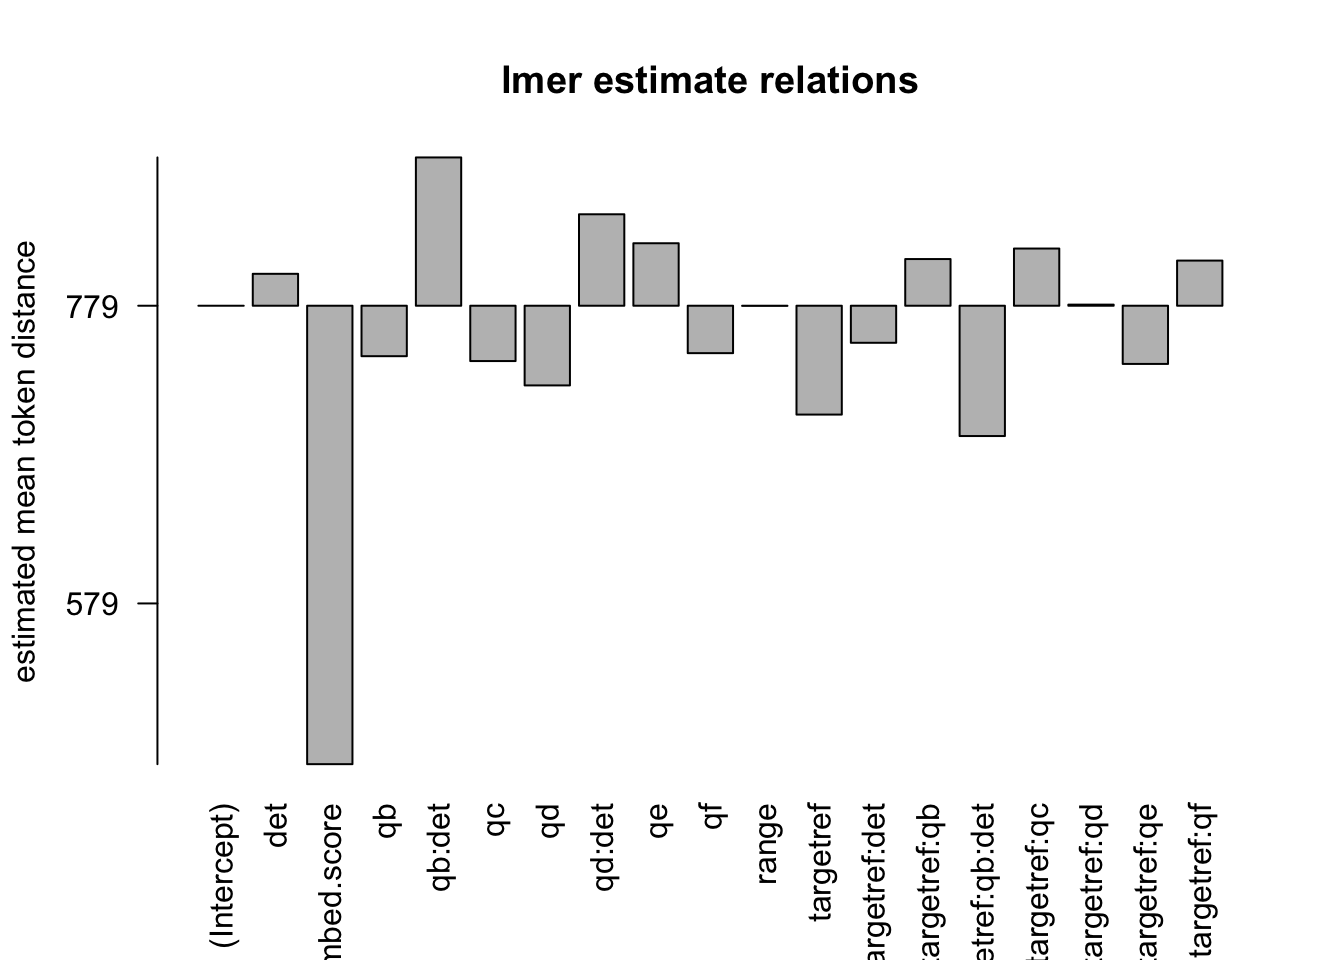
Figure 3.14: distances relation, normalised to all, distance ceiling = outliers removed
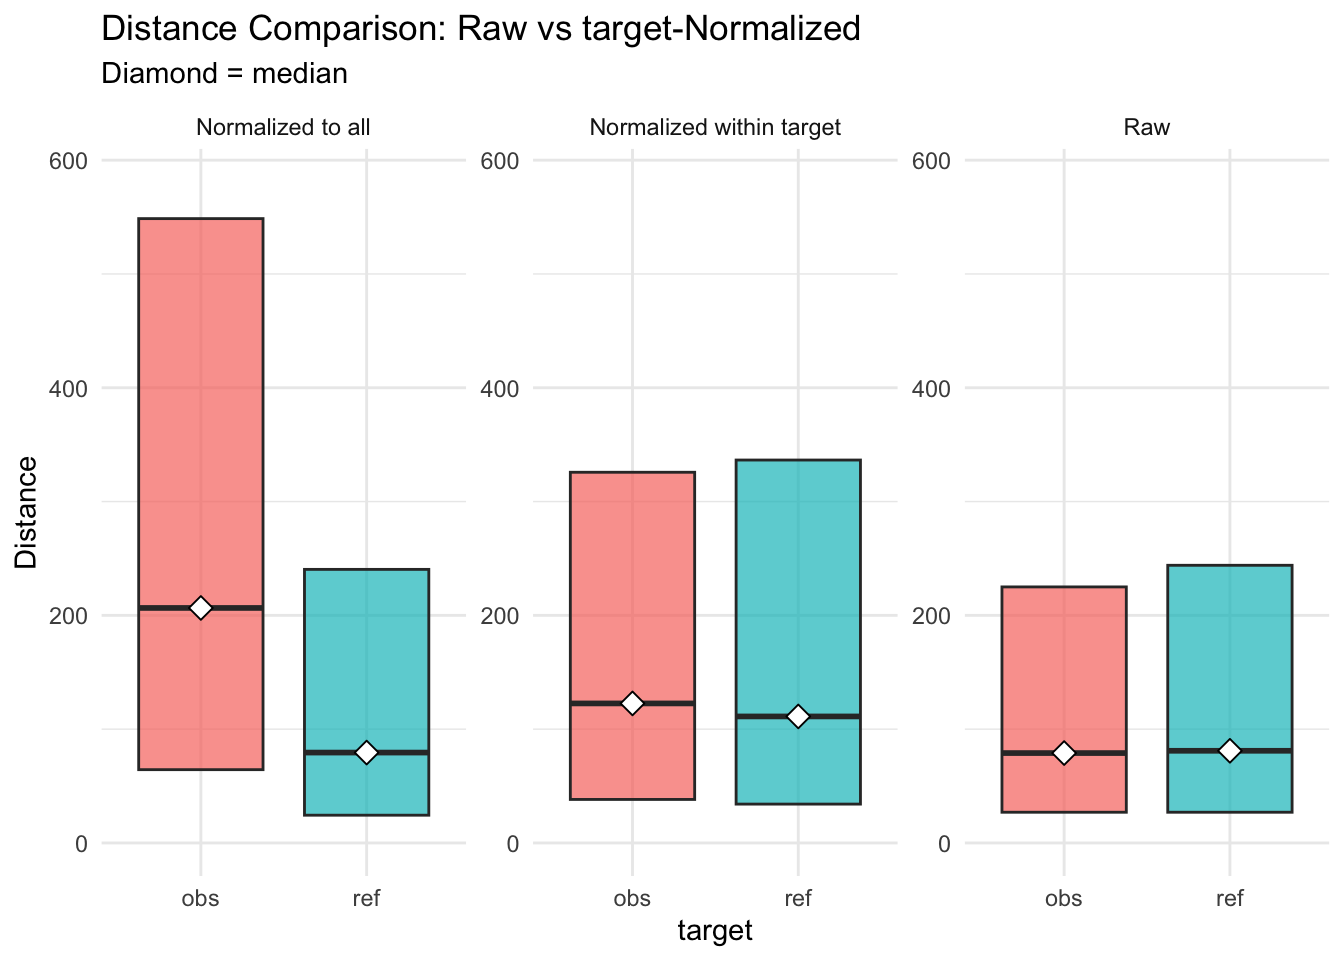
Figure 3.15: distances normalised vs. raw
3.5 evaluation model: 4
3.5.2 parameter setting
##                value
## norm_target _rel_ref
## det.t           TRUE
## limit           TRUE
## author          TRUE
## url             TRUE
## embed1          TRUE
## embed2             f
## range1          TRUE
## range2             f
## rel             TRUE
## lme            FALSE
## lemma          FALSE
3.5.3 anova analysis
3.5.3.1 anova plain
formula: [dist_rel_ref ~ target*q*det]
##                  Df     Sum Sq    Mean Sq   F value    Pr(>F)
## target            1 2.5135e+09 2513546743 7336.4625 < 2.2e-16 ***
## q                 5 6.8469e+07   13693706   39.9688 < 2.2e-16 ***
## det               1 9.0922e+06    9092198   26.5380 2.588e-07 ***
## target:q          5 1.5268e+07    3053543    8.9126 1.786e-08 ***
## target:det        1 1.3965e+06    1396511    4.0761  0.043496 *
## q:det             2 5.0309e+06    2515448    7.3420  0.000648 ***
## target:q:det      1 3.9858e+06    3985754   11.6335  0.000648 ***
## Residuals    126209 4.3240e+10     342610
## ---
## Signif. codes:  0 '***' 0.001 '**' 0.01 '*' 0.05 '.' 0.1 ' ' 1
3.5.3.2 anova of linear regression model
[anova(summary(lmer))]
## Type III Analysis of Variance Table with Satterthwaite's method
##                 Sum Sq   Mean Sq NumDF  DenDF   F value    Pr(>F)
## target         6358663   6358663     1   3519   23.4567 1.333e-06 ***
## q              4098347    819669     5 122421    3.0237 0.0098706 **
## det              67605     67605     1 118425    0.2494 0.6175055
## range        280081403 280081403     1   1025 1033.2042 < 2.2e-16 ***
## embed.score  139496414 139496414     1 122690  514.5942 < 2.2e-16 ***
## target:q       4314256    862851     5 123486    3.1830 0.0070933 **
## target:det     3006886   3006886     1 123325   11.0922 0.0008672 ***
## q:det          1997926    998963     2 120804    3.6851 0.0250971 *
## target:q:det   1221717   1221717     1 123315    4.5068 0.0337615 *
## ---
## Signif. codes:  0 '***' 0.001 '**' 0.01 '*' 0.05 '.' 0.1 ' ' 1
3.5.3.3 linear regression coefficients
formula: [dist_rel_ref ~ target*q*det+(1|aut_id)+range+(embed.score)+(1|url_id)]
## Linear mixed model fit by REML. t-tests use Satterthwaite's method [
## lmerModLmerTest]
## Formula: eval(expr(lmeform))
##    Data: dfa
##
## REML criterion at convergence: 1944096
##
## Scaled residuals:
##     Min      1Q  Median      3Q     Max
## -2.8643 -0.5282 -0.1721  0.2469  6.9244
##
## Random effects:
##  Groups   Name        Variance Std.Dev.
##  aut_id   (Intercept)  15871   126.0
##  url_id   (Intercept)  45496   213.3
##  Residual             271080   520.7
## Number of obs: 126226, groups:  aut_id, 8238; url_id, 2145
##
## Fixed effects:
##                    Estimate Std. Error         df t value Pr(>|t|)
## (Intercept)       1.090e+03  1.216e+01  8.969e+03  89.651  < 2e-16 ***
## targetref        -1.024e+02  1.485e+01  1.300e+03  -6.893 8.50e-12 ***
## qb               -4.744e+01  3.600e+01  1.218e+05  -1.318 0.187483
## qc               -5.203e+01  1.296e+01  1.226e+05  -4.014 5.98e-05 ***
## qd               -7.492e+01  5.246e+02  1.184e+05  -0.143 0.886426
## qe                5.876e+01  9.042e+00  1.247e+05   6.498 8.14e-11 ***
## qf               -4.458e+01  1.153e+01  1.244e+05  -3.866 0.000111 ***
## det               3.001e+01  1.125e+01  1.229e+05   2.667 0.007662 **
## range            -1.370e-01  4.261e-03  1.025e+03 -32.143  < 2e-16 ***
## embed.score      -4.311e+02  1.900e+01  1.227e+05 -22.685  < 2e-16 ***
## targetref:qb      4.389e+01  4.051e+01  1.225e+05   1.083 0.278599
## targetref:qc      5.378e+01  3.015e+01  1.237e+05   1.784 0.074435 .
## targetref:qd      1.040e+00  2.957e+01  1.238e+05   0.035 0.971935
## targetref:qe     -5.472e+01  2.242e+01  1.239e+05  -2.441 0.014662 *
## targetref:qf      4.246e+01  2.853e+01  1.238e+05   1.488 0.136766
## targetref:det    -3.485e+01  2.556e+01  1.239e+05  -1.363 0.172784
## qb:det            1.394e+02  3.955e+01  1.219e+05   3.526 0.000423 ***
## qd:det            8.600e+01  5.244e+02  1.184e+05   0.164 0.869736
## targetref:qb:det -1.225e+02  5.772e+01  1.233e+05  -2.123 0.033761 *
## ---
## Signif. codes:  0 '***' 0.001 '**' 0.01 '*' 0.05 '.' 0.1 ' ' 1
## fit warnings:
## fixed-effect model matrix is rank deficient so dropping 7 columns / coefficients
## Some predictor variables are on very different scales: consider rescaling
3.5.4 plots

Figure 3.16: compare distances by corpus, normalised to ref, distance ceiling = outliers removed

Figure 3.17: mean distances over query/corpus, normalised to ref, distance ceiling = outliers removed
| target | q | n | mean | median |
|---|---|---|---|---|
| obs | a | 42836 | 553 | 275 |
| ref | a | 58615 | 285 | 111 |
| obs | b | 2116 | 674 | 390 |
| ref | b | 1130 | 286 | 104 |
| obs | c | 5770 | 543 | 268 |
| ref | c | 1274 | 284 | 112 |
| obs | d | 5654 | 612 | 340 |
| ref | d | 1525 | 287 | 116 |
| obs | e | 3911 | 662 | 347 |
| ref | e | 671 | 295 | 105 |
| obs | f | 2311 | 523 | 313 |
| ref | f | 413 | 273 | 111 |
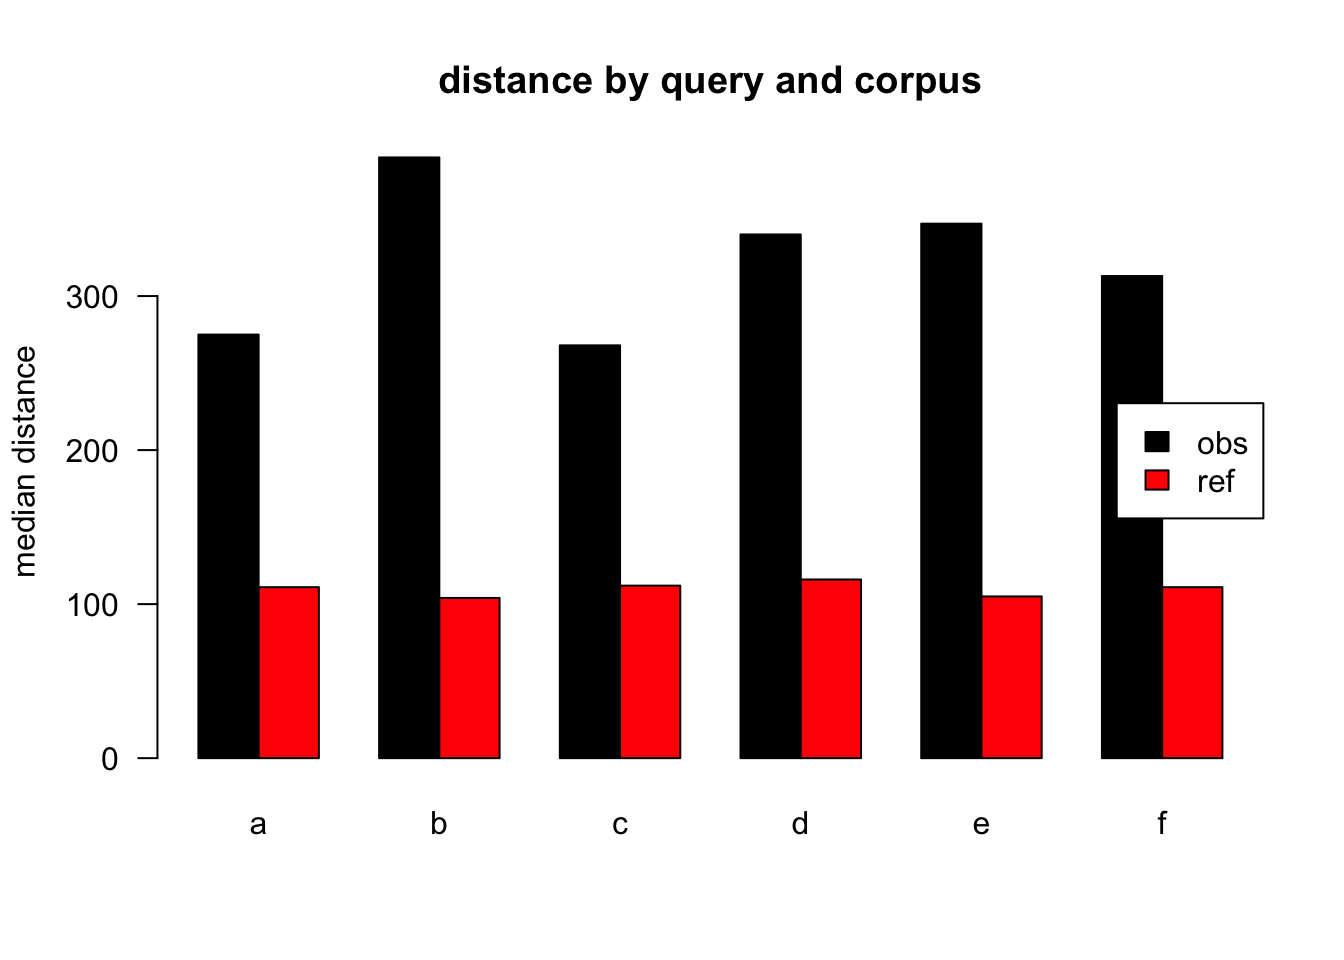
Figure 3.18: median distances over query/corpus, normalised to ref, distance ceiling = outliers removed
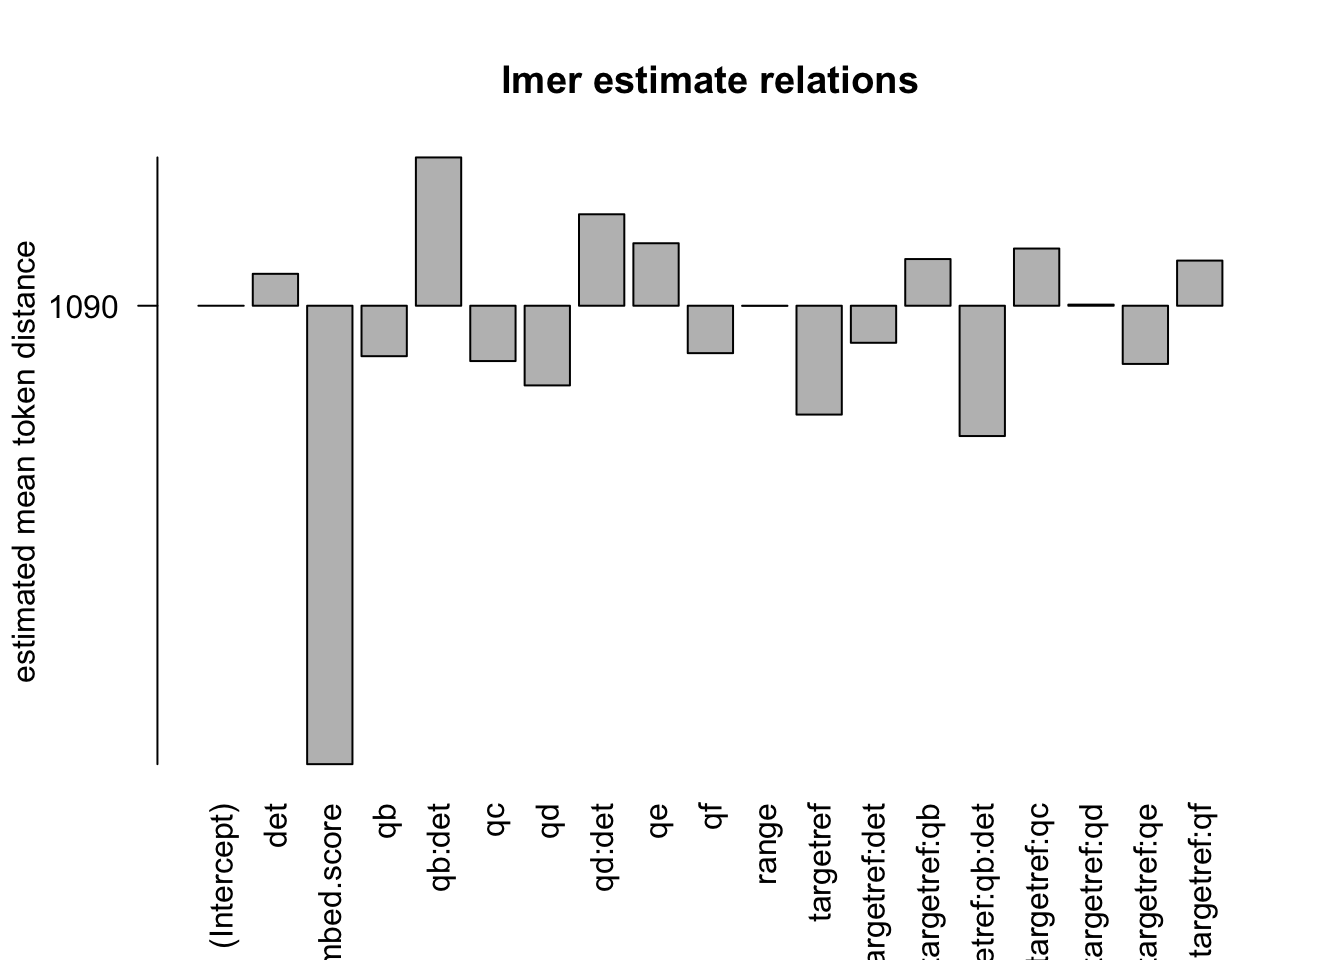
Figure 3.19: distances relation, normalised to ref, distance ceiling = outliers removed
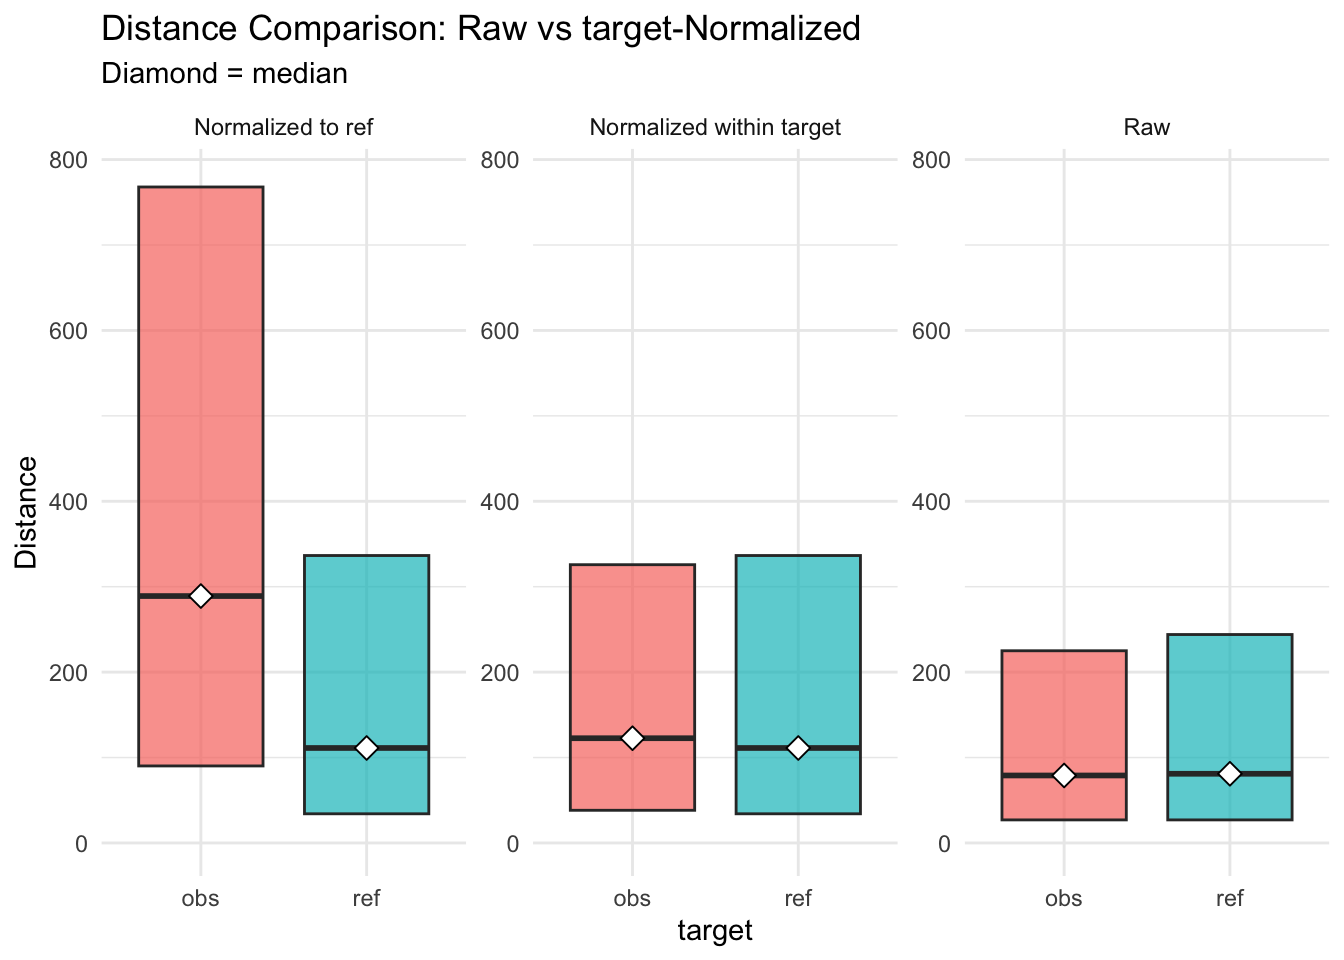
Figure 3.20: distances normalised vs. raw
3.6 evaluation model: 6
3.6.2 parameter setting
##             value
## norm_target
## det.t        TRUE
## limit        TRUE
## author       TRUE
## url          TRUE
## embed1       TRUE
## embed2          f
## range1       TRUE
## range2          f
## rel         FALSE
## lme         FALSE
## lemma       FALSE
3.6.3 anova analysis
3.6.3.1 anova plain
formula: [dist ~ target*q*det]
##                  Df     Sum Sq Mean Sq F value    Pr(>F)
## target            1    3284330 3284330 84.1223 < 2.2e-16 ***
## q                 5    1633205  326641  8.3663  6.39e-08 ***
## det               1     431404  431404 11.0496 0.0008873 ***
## target:q          5     441118   88224  2.2597 0.0457798 *
## target:det        1      16732   16732  0.4286 0.5126999
## q:det             2      25549   12774  0.3272 0.7209470
## target:q:det      1       6009    6009  0.1539 0.6948226
## Residuals    126209 4927490433   39042
## ---
## Signif. codes:  0 '***' 0.001 '**' 0.01 '*' 0.05 '.' 0.1 ' ' 1
3.6.3.2 anova of linear regression model
[anova(summary(lmer))]
## Type III Analysis of Variance Table with Satterthwaite's method
##                Sum Sq  Mean Sq NumDF  DenDF   F value Pr(>F)
## target            218      218     1  17034    0.0061 0.9377
## q              109358    21872     5 124317    0.6129 0.6901
## det             20678    20678     1 121247    0.5794 0.4465
## range        15332432 15332432     1    912  429.6377 <2e-16 ***
## embed.score  77286239 77286239     1 105351 2165.6761 <2e-16 ***
## target:q       304923    60985     5 125126    1.7089 0.1287
## target:det      17833    17833     1 124982    0.4997 0.4796
## q:det           37151    18576     2 123066    0.5205 0.5942
## target:q:det    23985    23985     1 124972    0.6721 0.4123
## ---
## Signif. codes:  0 '***' 0.001 '**' 0.01 '*' 0.05 '.' 0.1 ' ' 1
3.6.3.3 linear regression coefficients
formula: [dist ~ target*q*det+(1|aut_id)+range+(embed.score)+(1|url_id)]
## Linear mixed model fit by REML. t-tests use Satterthwaite's method [
## lmerModLmerTest]
## Formula: eval(expr(lmeform))
##    Data: dfa
##
## REML criterion at convergence: 1685333
##
## Scaled residuals:
##     Min      1Q  Median      3Q     Max
## -2.0402 -0.6622 -0.3317  0.3419  4.1697
##
## Random effects:
##  Groups   Name        Variance Std.Dev.
##  aut_id   (Intercept)  1394     37.34
##  url_id   (Intercept)  1072     32.74
##  Residual             35687    188.91
## Number of obs: 126226, groups:  aut_id, 8238; url_id, 2145
##
## Fixed effects:
##                    Estimate Std. Error         df t value Pr(>|t|)
## (Intercept)       2.533e+02  3.618e+00  1.966e+04  70.000  < 2e-16 ***
## targetref         1.326e+00  2.954e+00  1.890e+03   0.449  0.65362
## qb               -8.195e+00  1.300e+01  1.239e+05  -0.630  0.52845
## qc               -8.144e+00  4.675e+00  1.243e+05  -1.742  0.08150 .
## qd               -1.117e+02  1.902e+02  1.212e+05  -0.587  0.55726
## qe                1.392e+01  3.248e+00  1.256e+05   4.285 1.83e-05 ***
## qf               -6.628e+00  4.145e+00  1.253e+05  -1.599  0.10981
## det               3.793e+00  4.058e+00  1.245e+05   0.935  0.35005
## range             1.535e-02  7.406e-04  9.124e+02  20.728  < 2e-16 ***
## embed.score      -3.110e+02  6.682e+00  1.054e+05 -46.537  < 2e-16 ***
## targetref:qb      4.017e+00  1.464e+01  1.244e+05   0.274  0.78373
## targetref:qc      4.577e+00  1.089e+01  1.253e+05   0.420  0.67442
## targetref:qd     -2.061e+00  1.069e+01  1.253e+05  -0.193  0.84707
## targetref:qe     -2.134e+01  8.099e+00  1.255e+05  -2.635  0.00841 **
## targetref:qf      8.889e+00  1.031e+01  1.254e+05   0.862  0.38849
## targetref:det     1.178e+00  9.236e+00  1.253e+05   0.127  0.89855
## qb:det            1.714e+01  1.428e+01  1.239e+05   1.200  0.23002
## qd:det            1.126e+02  1.902e+02  1.212e+05   0.592  0.55380
## targetref:qb:det -1.710e+01  2.086e+01  1.250e+05  -0.820  0.41233
## ---
## Signif. codes:  0 '***' 0.001 '**' 0.01 '*' 0.05 '.' 0.1 ' ' 1
## fit warnings:
## fixed-effect model matrix is rank deficient so dropping 7 columns / coefficients
## Some predictor variables are on very different scales: consider rescaling
3.6.4 plots
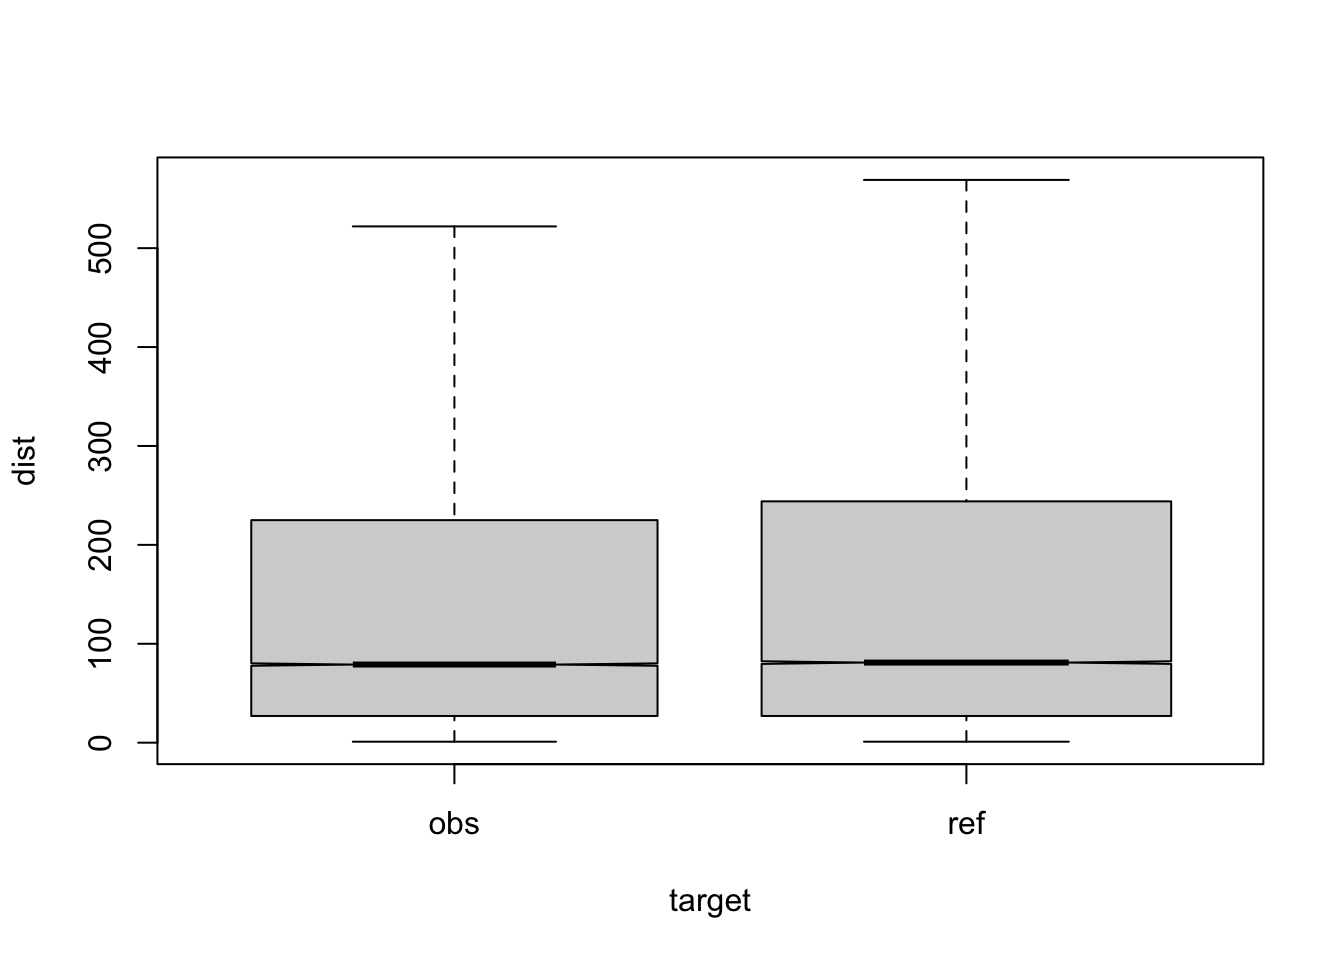
Figure 3.21: compare distances by corpus, not normalised, distance ceiling =outliers removed
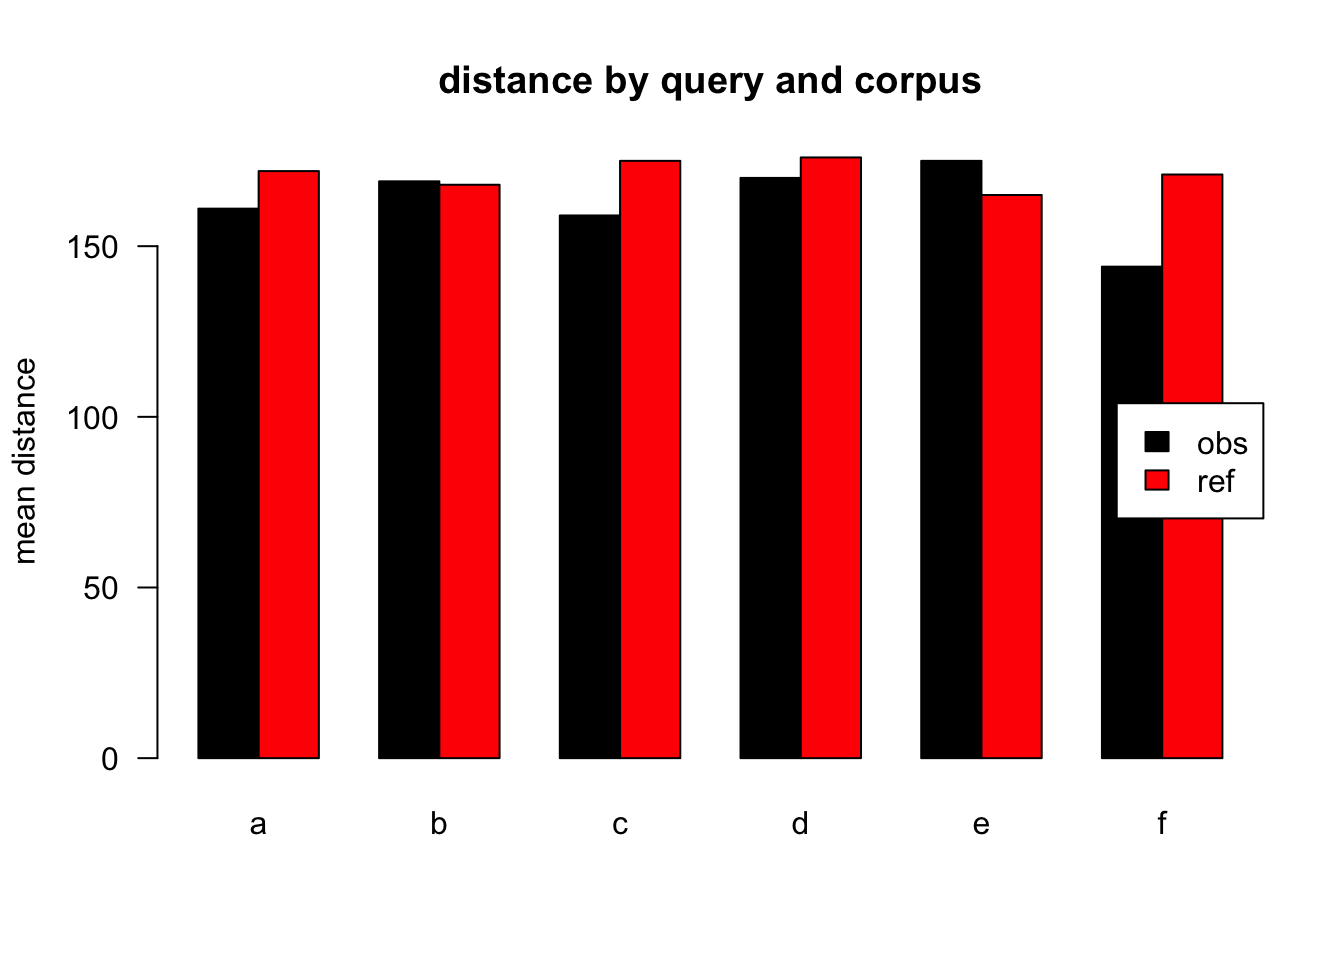
Figure 3.22: mean distances over query/corpus, not normalised, distance ceiling =outliers removed
| target | q | n | mean | median |
|---|---|---|---|---|
| obs | a | 42836 | 161 | 77 |
| ref | a | 58615 | 172 | 81 |
| obs | b | 2116 | 169 | 109 |
| ref | b | 1130 | 168 | 78 |
| obs | c | 5770 | 159 | 75 |
| ref | c | 1274 | 175 | 84 |
| obs | d | 5654 | 170 | 86 |
| ref | d | 1525 | 176 | 83 |
| obs | e | 3911 | 175 | 92 |
| ref | e | 671 | 165 | 71 |
| obs | f | 2311 | 144 | 62 |
| ref | f | 413 | 171 | 82 |
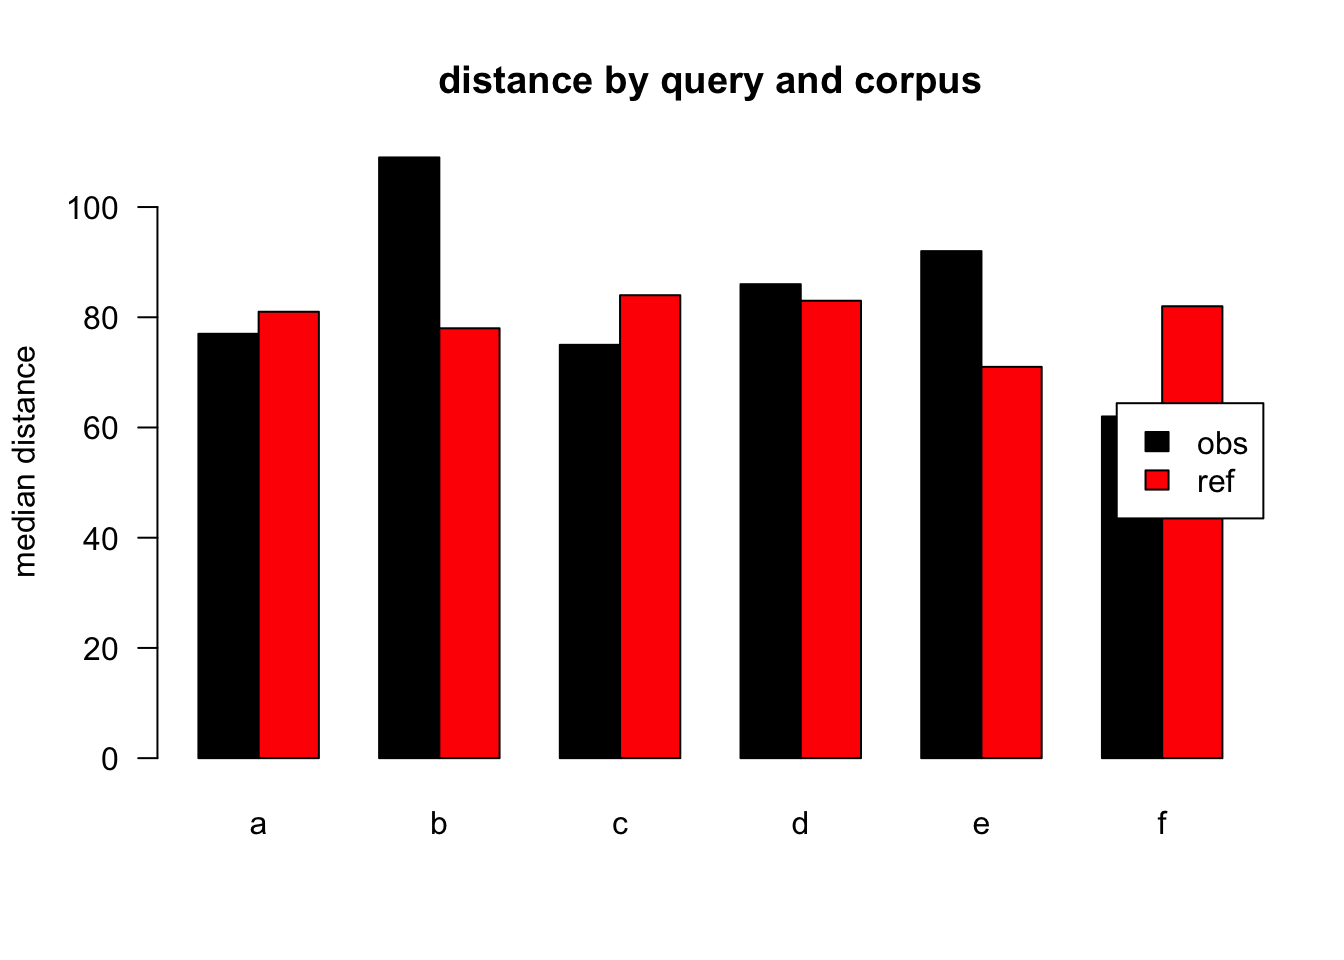
Figure 3.23: median distances over query/corpus, not normalised, distance ceiling =outliers removed
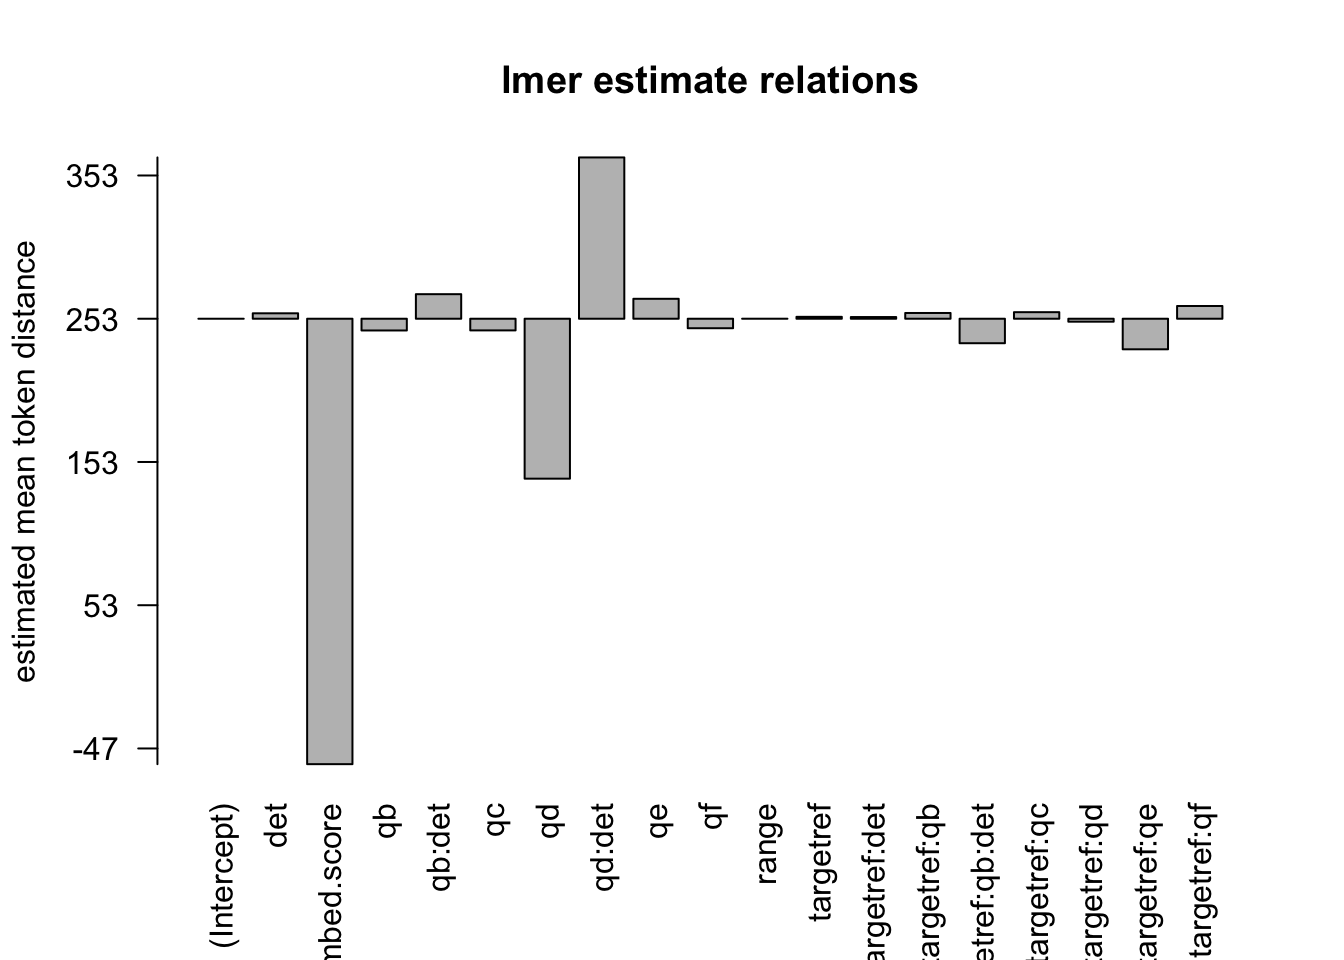
Figure 3.24: distances relation, not normalised, distance ceiling =outliers removed
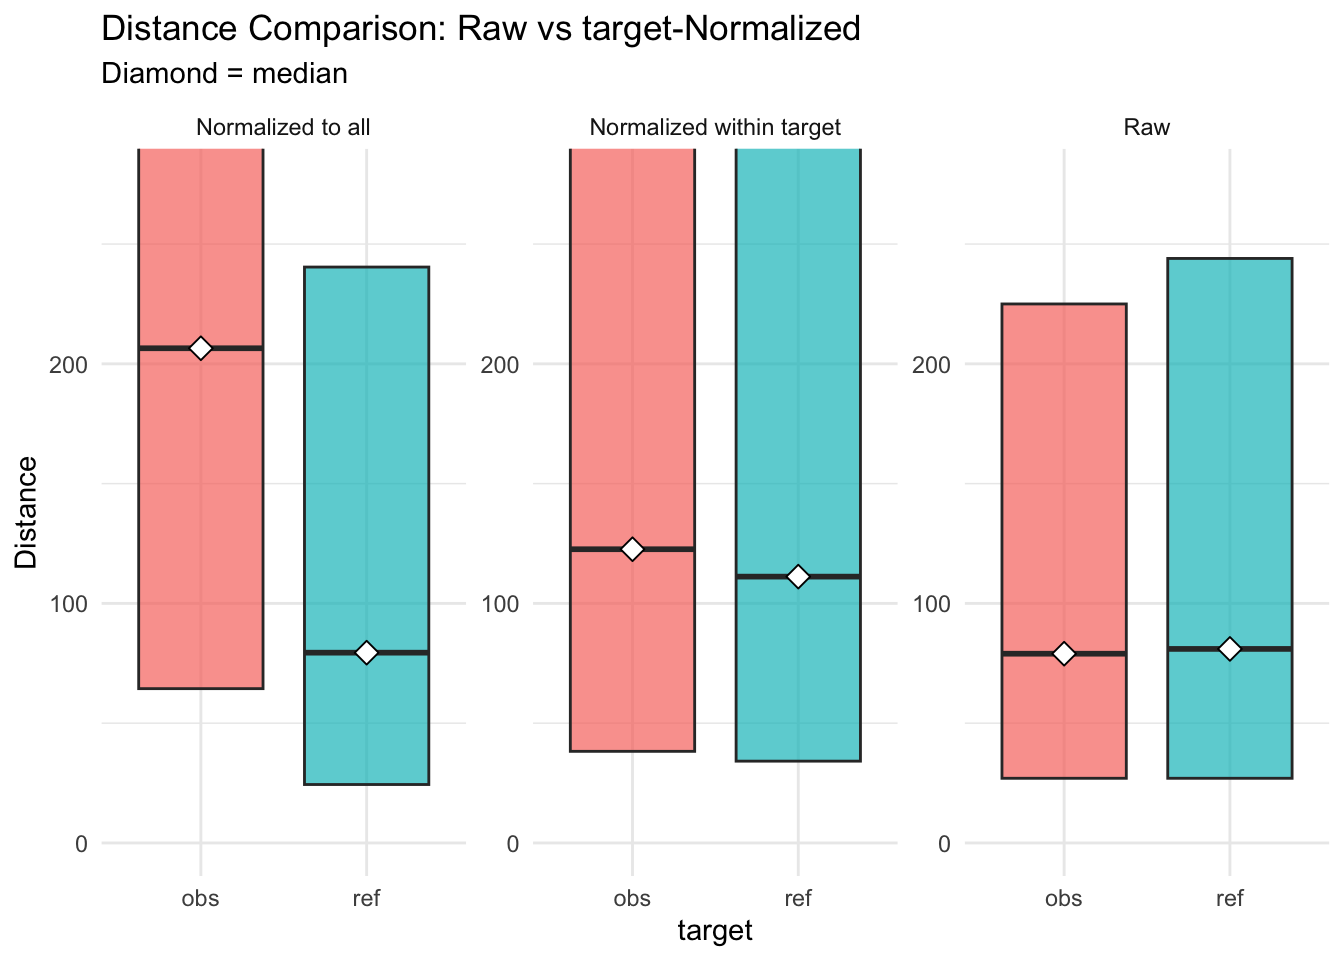
Figure 3.25: distances normalised vs. raw
3.7 Selbständigkeit: benutzte Hilfestellung
In der vorliegenden Arbeit wurden keinerlei nicht erlaubte Hilfsmittel zur Erstellung von Inhalten verwendet. Die Benutzung von KI beschränkt sich auf (Tabelle):
| Hilfsmittel | Verwendung |
|---|---|
| github copilot | Hilfe bei der Skripterstellung (R, Python) zur Programmierung der Distanzenberechnung, semantic embeddings und statistischen Auswertung |
| chatgpt.com | dito |
| claude.ai | dito |
| deepseek.com | dito |
| nomic-embed-text (model) | calculate semantic embeddings |
3.8 references
literature used and alii…